
Figure 2. Baseline and post-OTX015 expression of BRD2/3/4 and c-MYC.
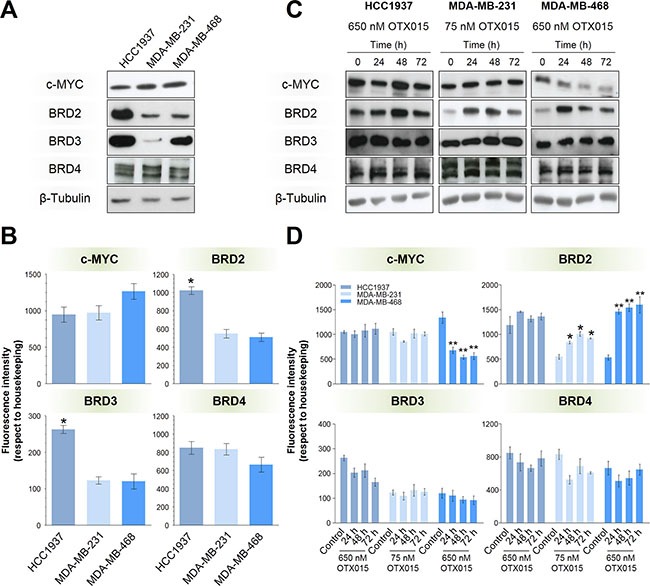
Basel expression of BRD2/3/4 and c-MYC in terms of protein (A) and mRNA (B) levels were evaluated in the three cell lines by Western blotting and qRT-PCR, respectively. Protein (C) and mRNA (D) levels were evaluated after 24-, 48- and 72-h OTX015 (650 nM in HCC1937 and MDA-MB-468 cells, and 75 nM in the MDA-MB-231 cell line). Significant differences in mRNA levels were determined by one-way ANOVA test (p < 0.01) followed by an SNK a posteriori test (*p < 0.05, **p < 0.01). Western blots are representative of at least three independent experiments. Bars and vertical lines represent the mean ± SEM, respectively (n = 3).