
Figure 3. Gene expression profiling in OTX015-treated TNBC cell models.
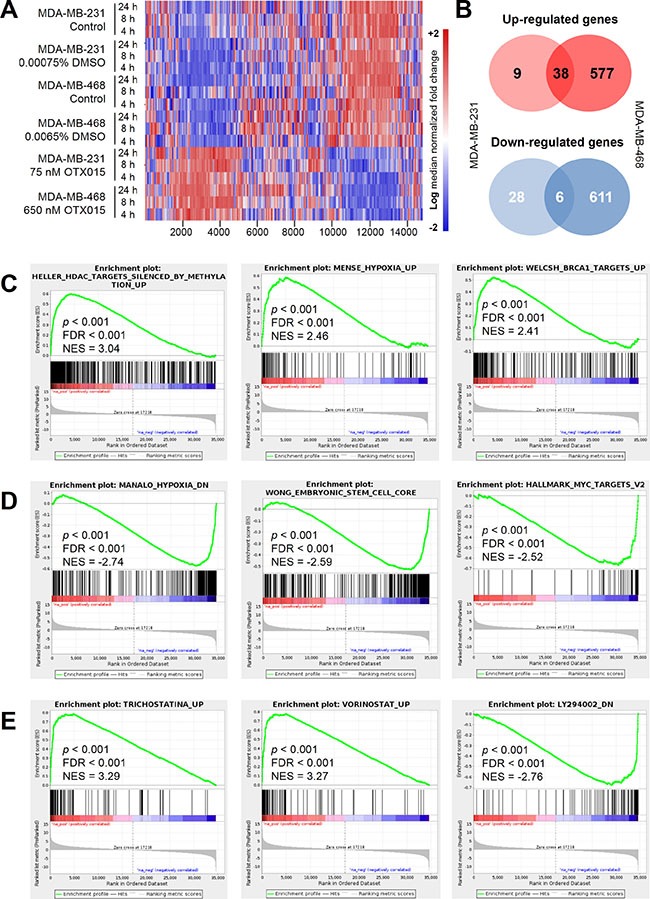
(A) GEP heat maps in OTX015-treated MDA-MB-231 and MDA-MB-468 cell lines, compared to vehicle-treated control cells. Red and blue indicate up-regulated and down-regulated genes respectively. (B) Venn diagram of 81 and 1286 differentially expressed genes in MDA-MD-231 and MDA-MB-468 OTX015-treated cells, respectively. GSEA analyses showed common signatures enriched, using the complete MSigDB (C), up-regulated and (D), down-regulated) and CMAP databases (E) in OTX015-treated MDA-MB-231 and MDA-MB-468 cell lines. FDR, false discovery rate; NES, normalized enrichment score.