
Figure 5. Antitumor activity of OTX015 in combination with everolimus in vitro and in MDA-MB-231 xenografts.
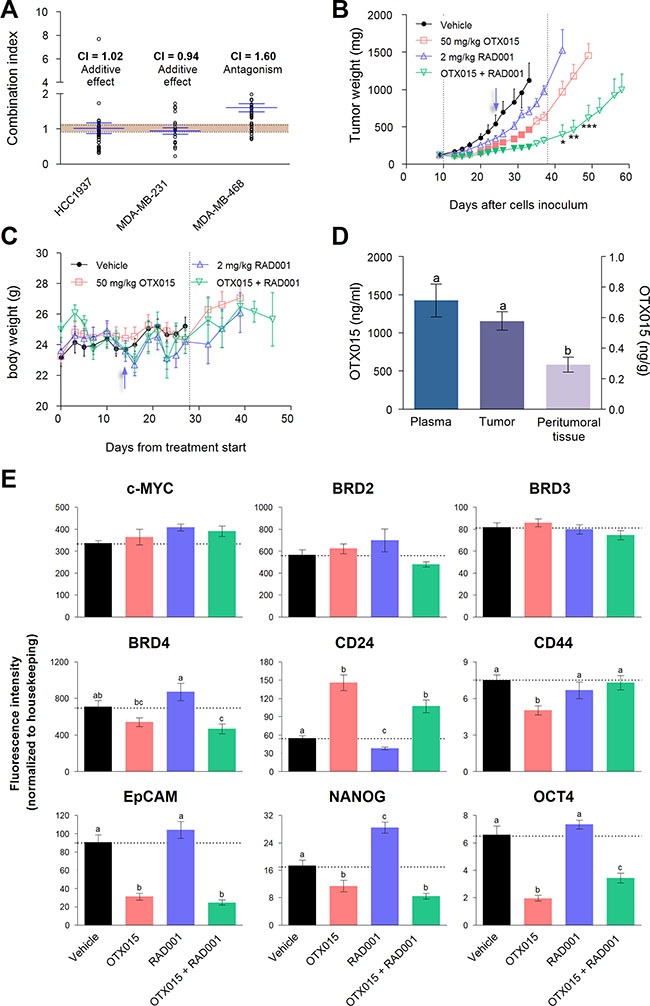
(A) Antiproliferative effects of concomitant OTX015 and everolimus exposure for 72 h was evaluated with the MTT assay in all three TNBC cell lines. Synergism is defined as a combination index < 0.9; values between 0.9 and 1.10 indicate an additive effect (shown as dotted lines); and values > 1.10, indicate antagonism (n = 3). (B) Antitumor effects of 50 mg/kg OTX015 twice daily (□) and 2 mg/kg everolimus thrice daily (RAD001;  ) were evaluated as single agents and in combination (
 ) in MDA-MB-231 murine xenografts. Tumor weight was compared between drug regimens at each time point using a two-way ANOVA test (p < 0.001) followed by Bonferroni a posteriori test on log-transformed data. Color-filled symbols indicate significant (p < 0.05) differences between treated vs. vehicle mice (·). Significant differences in tumor mass between the combination versus single agent treatment after drug withdrawal are shown (*p < 0.05, **p < 0.01 and ***p < 0.001). Dotted lines define the treatment period. (C) Animal body weight during treatment (dotted lines) and subsequently. Results represent the mean ± SEM (during treatment, n = 9). Arrows in B and C indicate the change in the everolimus dosing schedule. (D) OTX015 levels in plasma and tissues from OTX015-treated mice, 4 h after the last dose. Variations in OTX015 concentrations detected between plasma, tumor and peritumoral tissue were evaluated by a one-way ANOVA test (p < 0.01) followed by an SNK a posteriori test. Letters above the bars indicate substantial differences (p < 0.05). (E) mRNA levels of c-MYC, BRD2/3/4, and CSC markers were determined by qRT-PCR in MDA-MB-231 tumors after 4-week treatment with OTX015 (■), everolimus (RAD001, ■) or the combination (■). Variations between the experimental groups were evaluated by a one-way ANOVA test (p < 0.001) followed by an SNK a posteriori test. Letters above the bars indicate significant differences (p < 0.05) in mRNA levels among the experimental groups. Bars and vertical lines represent the mean ± SEM, respectively (n = 4).