
Figure 1.
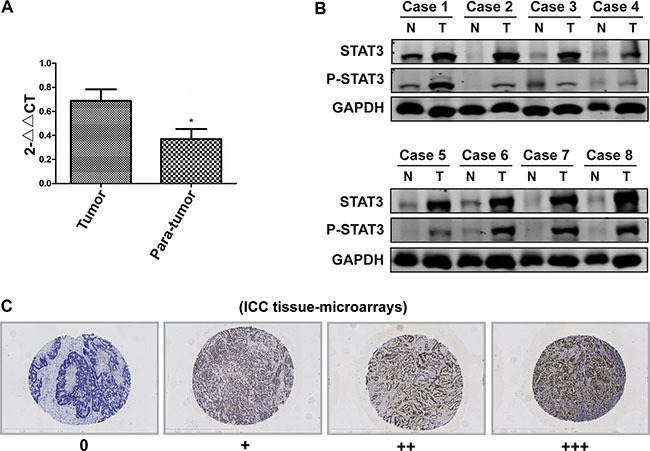
(A) The STAT3 mRNA levels in tumor and adjacent liver tissues were detected by real-time PCR. *P < 0.05, compared with tumor group. (B) The STAT3 protein levels in tumor and adjacent liver tissues were detected by Western Blot. Representative image is illustrated. (C) The TMA assay was performed to detect of the STAT3 expression. The STAT3 was stained with an anti-STAT3 antibody, and the samples were grouped into high and low expression group according to the STAT3 intensity (magnification, ×100).