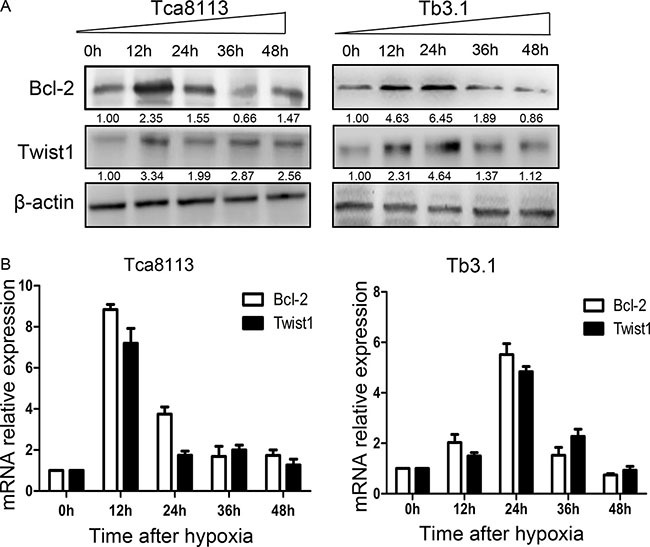
Figure 2. Hypoxia conditions enhance Bcl-2 and Twist1 expression.

(A) Expression levels of Bcl-2 and twist under hypoxia conditions were assessed with western blot analysis. In two cell lines Tca8113 and Tb3.1, Bcl-2 and Twist1 showed similar expression kinetics induced by hypoxia. The expression peaks of Bcl-2 and Twist1 in Tca8113 were detected when hypoxia was relieved after 12 hours, while Tb3.1 peaks at 24 hour. (B) For quantitative PCR evaluated messenger RNA (mRNA) , the results were similar.
