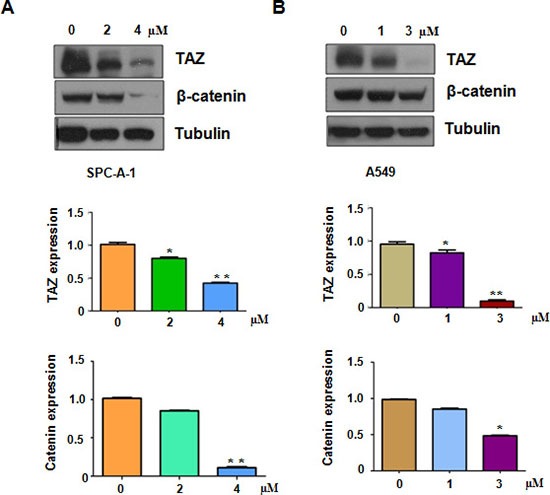
Figure 3. Rottlerin downregulated TAZ expression.

(A) Top panel, the expression of TAZ, β-catenin was determined by western blotting analysis in SPC-A-1 cells. Bottom panels, Quantitative results are illustrated for Top panel. (B) Top panel, the expression of TAZ, β-catenin was determined by western blotting analysis in A549 cells. Bottom panels, Quantitative results are illustrated for Top panel.* P < 0.05, **< 0.01 vs control (DMSO treatment).
