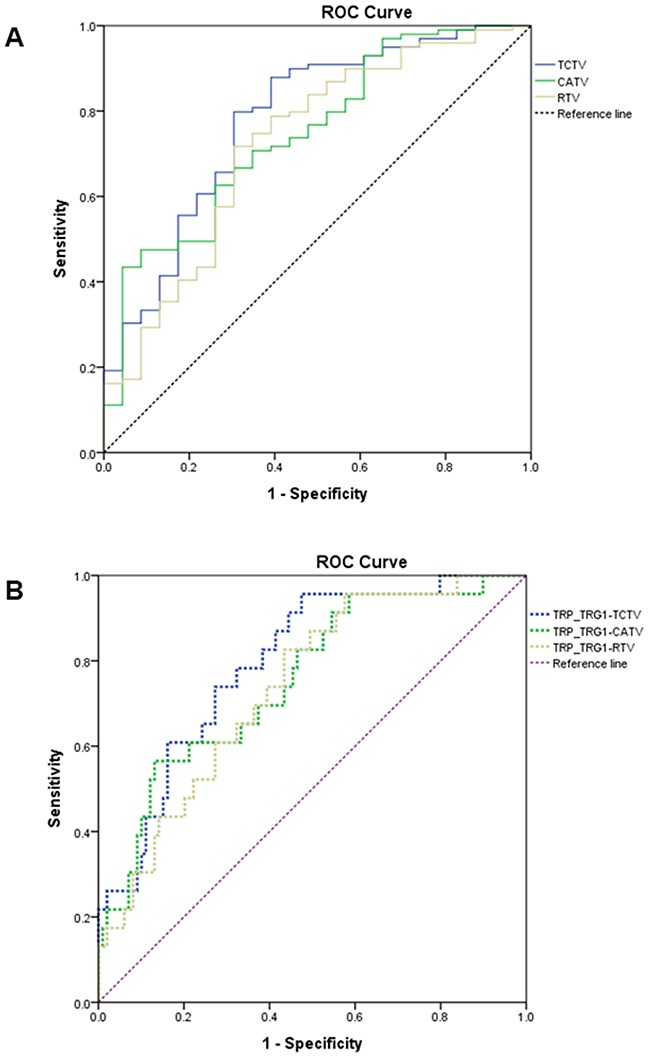
Figure 2. A. The blue, green, and yellow solid lines represent the ROC curve of the TCTV, CATV, and RTV-based prediction of the pCR.

B. The blue, green, and yellow dashed lines represent the ROC curve of the TRP–TRG ≦ 1–TCTV, TRP–TRG ≦ 1–CATV, and TRP–TRG ≦ 1–RTV prediction of the pCR (ROC, receiver operating characteristic; TCTV, tumor compactness-corrected tumor volume; CATV, cylindrical approximated tumor volume; TRP, tumor response probability; TRG, tumor regression grade; pCR, pathologic complete remission).
