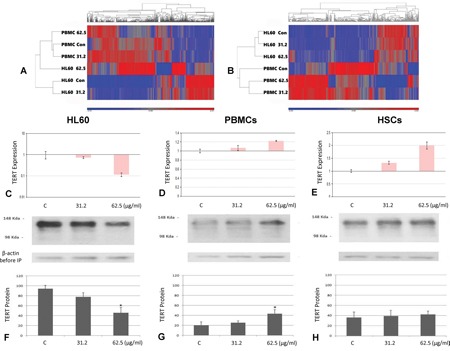
Figure 3. TERT gene and protein expression among different treatment and cells.

Heat map analysis of control versus TSY-1 treatment in HL60 cells (A) and PBMCs (B). A. up- and downregulation of the 765 genes that are differentially expressed between HL60 control and HL60 TSY-1 treatment. To generate the heat map, the data from all 6 samples is used to generate a standardized mean of 0 and a standard deviation of 1. Each sample is then compared to this mean to determine up or downregulation of the gene. The map shows that HL60 control and HL60 TSY-1 62.5 μg/ml are very different in gene expression. Note that PBMC control is very different (almost like opposites) compared to HL60 control. This indicates that a different set of genes are differentially expressed in the PBMCs. B. up- and downregulation of the 501 genes that are differentially expressed between PBMC control and PBMC TSY-1 treatment. The map shows the PBMC control and PBMC TSY-1 62.5 μg/ml are very different in gene expression. Note that PBMC control looks very different from HL60 control.
qPCR analysis of TERT gene expression in HL60 cells C., PBMCs D. and HSCs E. TERT gene expression was measured by qPCR analysis. β-actin served as a reference gene for each triplicate set of reaction. Compared with the untreated control, TERT gene expression decreased in HL60 cells but increased in PBMCs and HSCs. * P < 0.05, compared to untreated control, t-test.
TERT protein expression in HL60 cells F., PBMCs G. and HSCs H. The cells were treated by the TSY-1 of different concentration (31.2 μg/ml and 62.5 μg/ml). Cell lysates were immunoprecipitated with TERT antibody followed by SDS-PAGE analysis. Immunoblot picture shows TSY-1 treatment decreased TERT protein level in HL60 cells but not in PBMCs and HSCs. * P < 0.05, compared to untreated control, t-test. PBMC: normal peripheral blood mononuclear cells, HSCs: CD34+ hematopoietic stem cells.
