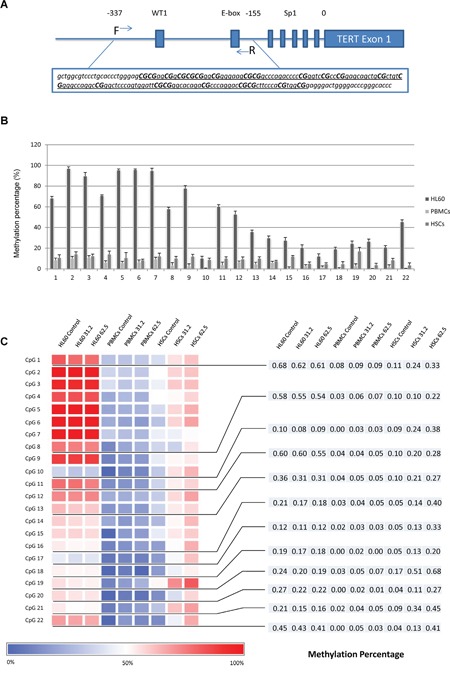
Figure 5. Distinct methylation profiles among different cells and treatment.

A. DNA fragment in TERT core promoter region was amplified. The underlined region was analyzed by pyrosequencing, which included 22 CpG sites. B. The percentage of methylation across 22 CpG sites among untreated HL60 cells, PBMCs and HSCs. C. Heatmap of DNA methylation profiling of TERT core promoter. The bottom blue-red scale bar refers to the degree of methylation measured by pyrosequencing. CpG 1, 8, 10, 11, 13, 16, 17, 18, 19, 20, 21 and 22 showed an opposite change of methylation pattern in a dose-response manner between HL60 cells (downregulated) and PBMCs / HSCs (upregulated). PBMC: normal peripheral blood mononuclear cells, HSCs: CD34+ hematopoietic stem cells.
