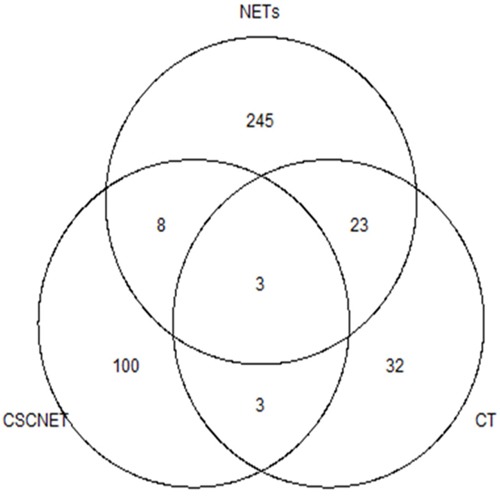
Figure 4. Venn diagram of frequently mutated gene(s) shared across CSCNETs, NETs and CT.

Recurrently mutated genes were selected at ≥5% in CTs and other NETs, and ≥50% (≥3 samples) in our CSCNETs. Mutated genes are listed in Supplementary Table 8A.

Recurrently mutated genes were selected at ≥5% in CTs and other NETs, and ≥50% (≥3 samples) in our CSCNETs. Mutated genes are listed in Supplementary Table 8A.