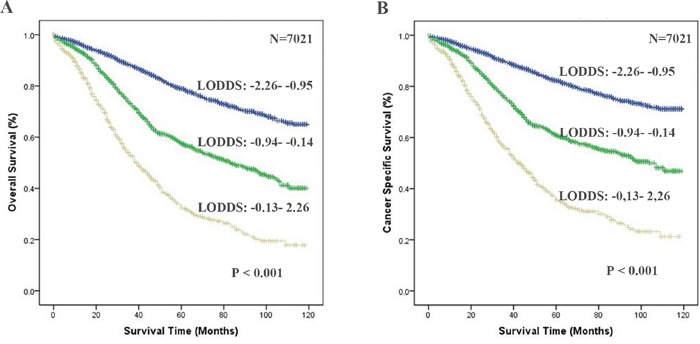
Figure 1.

Comparison of the areas under curves of the number of RLNs, PLNs, LNR and LODDS to predict the impact of these factors on OS A. and CSS B. in the SEER training cohort. The green lines represent LODDS predicted survival, the blue lines represent the LNR predicted survival, the red line represent PLNs predicted survival and the black line represent RLNs predicted survival. Abbreviation: OS, overall survival; CSS, cancer specific survival; RLNs, the number of resected lymph node; PLNs, the number of positive lymph node; LNR, ratio of PLNs to RLNs; LODDS, log of odds between the number of positive lymph node (PLNs) and number of negative nodes.
