
Figure 4.
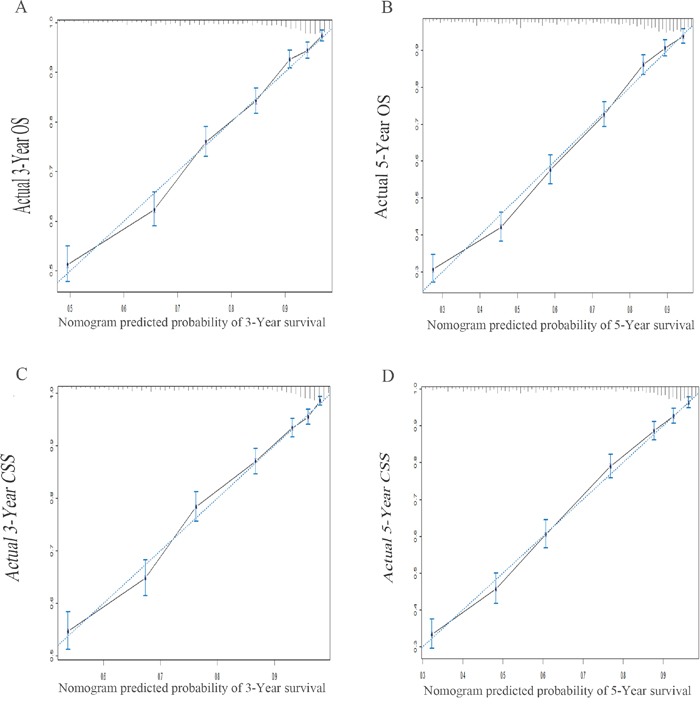
The calibration plots predicting overall survival A-B. and cancer specific survival C-D. at 3- and 5-year point in the training cohort. The dashed line represents a perfect match between the nomogram predicted probability (x-axis) and the actual probability calculated by Kaplan-Meier analysis (y-axis). Abbreviation: OS, overall survival; CSS, cancer specific survival.