
Figure 3. Induction of thyroid cancer cell cycle arrest and apoptosis by N-cadheirn knockdown.
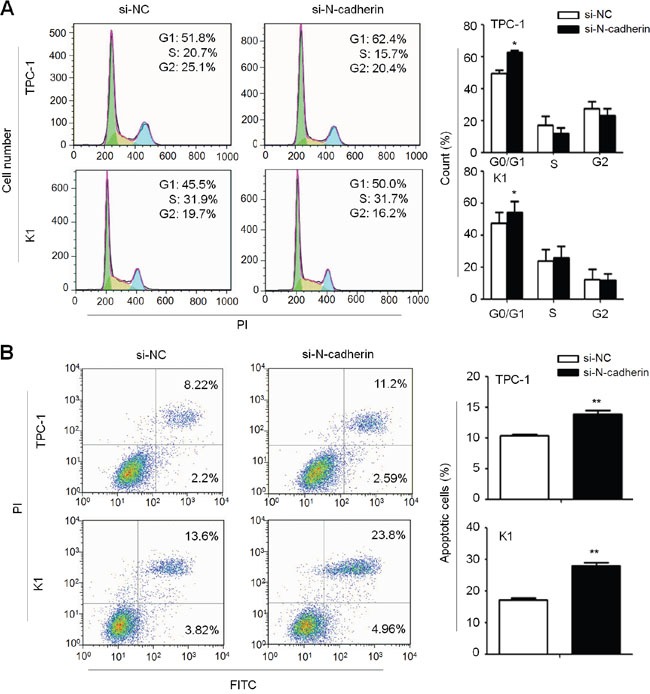
A. TPC-1 and K1 cells were transiently transfected with the indicated siRNAs. DNA content was measured by flow cytometry to determine cell cycle fractions. The fraction of cells in each cell cycle phase was indicated in the figures. B. Early apoptotic cells (Annexin-V-FITC positive and PI negative) in bottom right quarter and late apoptotic cells (Annexin-V-FITC and PI positive) in top right quarter were measured by cytometry analysis using Annexin V-FITC Detection Kit, respectively. The data were presented as mean ± SD of values from three independent experiments. Statistically significant differences were indicated: *, P<0.05; **, P<0.01.