
Figure 1.
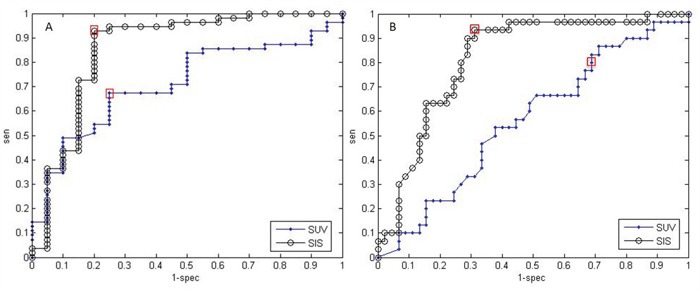
A. ROC analysis for ΔSIS and ΔSUVmax in discriminating responders from non responders. Cut-off value in ΔSIS (black line, AUC = 0.86) changed of 6.0% yields 92.7% of sensitivity and 80.0% of specificity. Cut-off value in ΔSUVmax (blue line, AUC = 0.71) of 59.7% gave a sensitivity of 67.3% and a specificity of 75.0%. B. ROC analysis for ΔSIS and ΔSUVmax to identify pathological complete response. Cut-off value in ΔSIS (black line, AUC = 0.82) changed of 30.3% yields 93.3% of sensitivity and 68.9% of specificity. Cut-off value in ΔSUVmax (blue line, AUC = 0.57) of 43.9% gave a sensitivity of 80.0% and a specificity of 31.1%. The two red rectangles highlight the sensitivities and specificities corresponding to the optimal thresholds.