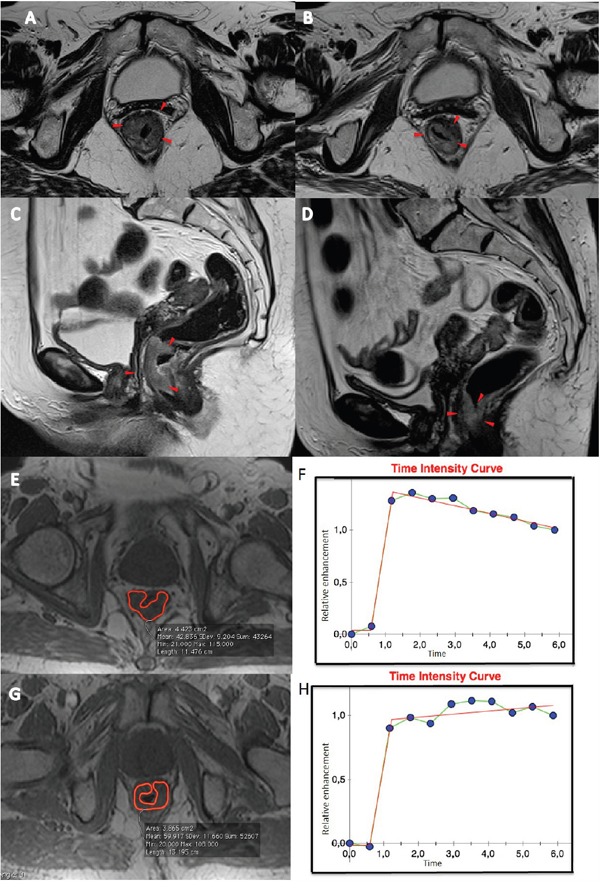
Figure 4.

Patient n. 68: T2-weighted images in axial A and sagittal C plan before B the treatment and after treatment D. The morphologic images (A and C) before CRT, showed heterogeneous irregular thickening along the rectal wall spreading into the perirectal fat (A and C, arrowheads). After CRT, a hypointense area with thickening of the rectal wall and straining into perirectal fat (B and D, arrowheads) is observed. Median Time intensity curve of the volume of interest E and G, before F and after treatment H are shown. These curves showed different contrast enhancement, with a ΔSIS value of 39.54% classifying the patient as responder.
