Figure 5.

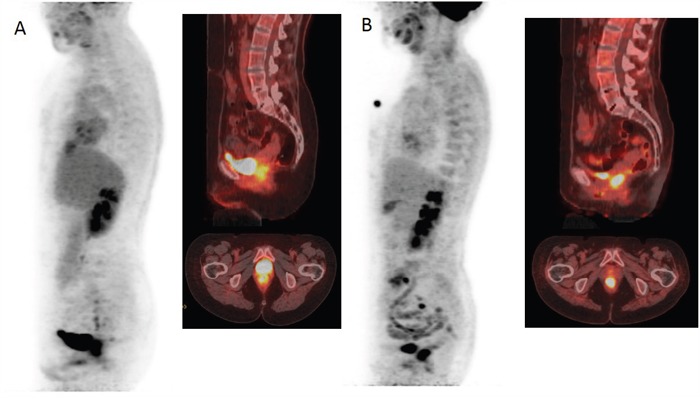
18F-FDG PET/CT images before A and after B treatment demonstrating a minimal reduction of glucose metabolism with ΔSUVmax of 6.07% classifying the patient as non responder.

18F-FDG PET/CT images before A and after B treatment demonstrating a minimal reduction of glucose metabolism with ΔSUVmax of 6.07% classifying the patient as non responder.