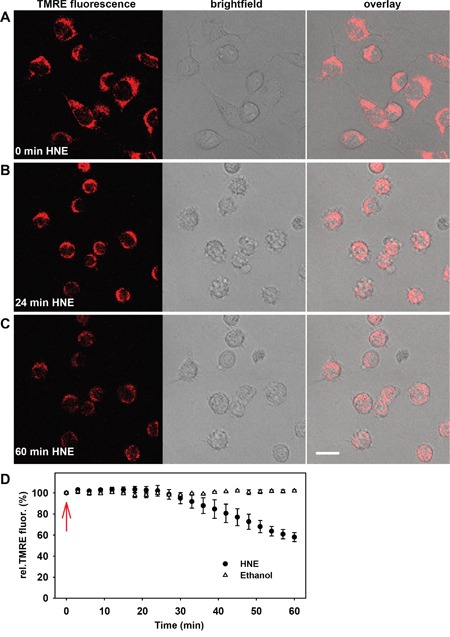
Figure 1. Alteration of the mitochondrial membrane potential and cellular morphology after addition of 4-hydroxy- 2-nonenal (HNE) to N18TG2 neuroblastoma cells in a typical experiment.

A-C. Fluorescence (left), brightfield (middle) and merged (right) images of the cells were recorded A. without HNE, B. 24 minutes and C. 60 minutes after addition of 16 μM HNE. Cell medium contained 21.6 mM glucose, 3.85 mM glutamine, 9.6% fetal bovine serum and 1.92 mM sodium pyruvate. Scale bar is 20 μm. D. Time course of normalized TMRE fluorescence after addition of 16 μM HNE and ethanol as a control (arrow). TMRE fluorescence was normalized to the fluorescence at time point 0 min. Data are presented as mean values ± SEM from at least 5 independent experiments.
