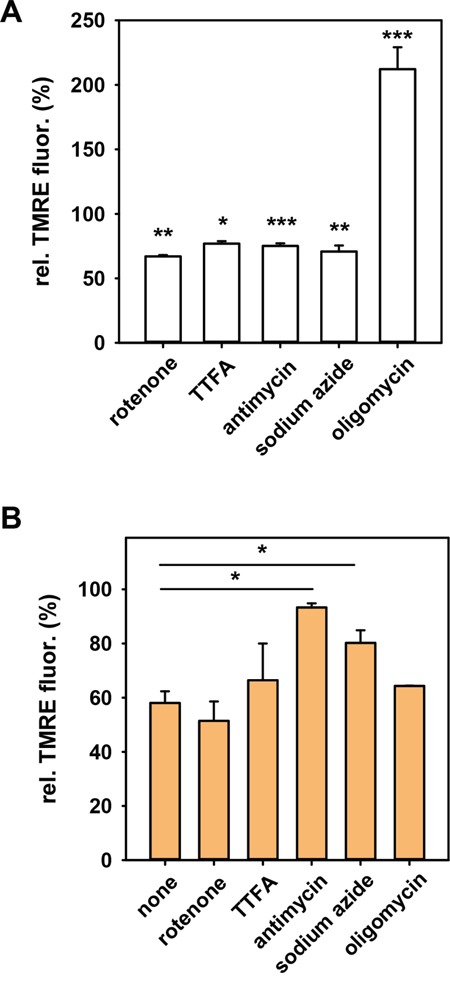
Figure 2. Effect of respiratory chain complexes inhibition on the mitochondrial membrane potential in N18TG2 cells.

A. in the absence and B. in the presence of HNE. TMRE-stained cells were incubated with inhibitors of complex I (10 nM rotenone), complex II (0.5 mM TTFA), complex III (50 μM antimycin A), complex IV (10 μM sodium azide) and complex V (2 μM oligomycin). TMRE fluorescence measured 30 minutes after addition of inhibitors was normalized to the fluorescence in the absence of the inhibitors (control with ethanol). The final concentration of HNE was 16 μM. Data are presented as mean values ± SEM. * p < 0.05, ** p < 0.01, *** p < 0.001.
