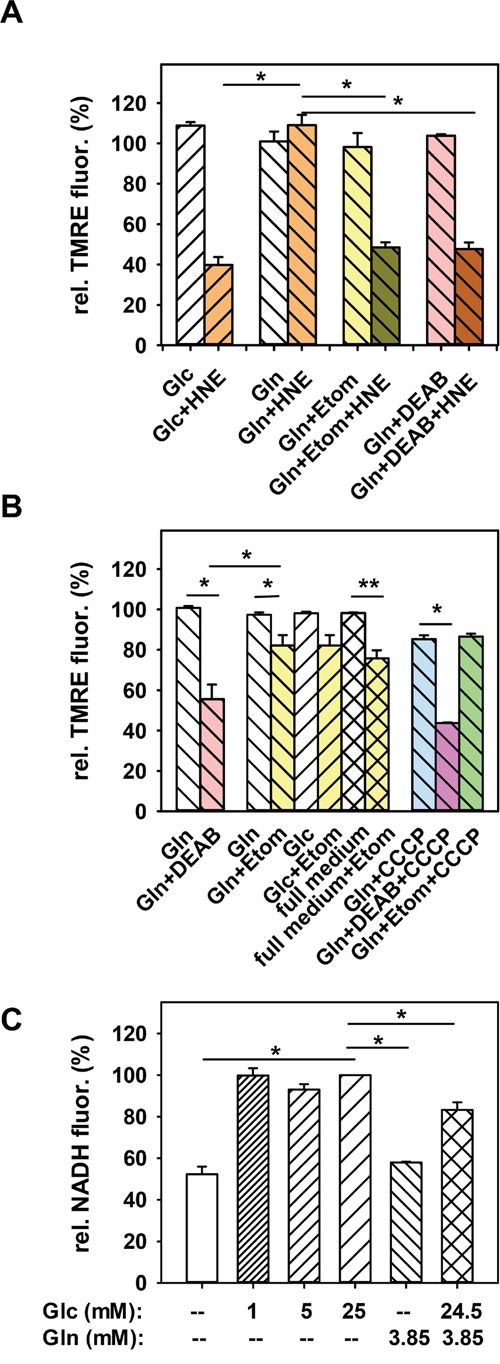
Figure 4. Dependence of the HNE-induced mitochondrial membrane potential alteration of N18TG2 cells on β-oxidation.

A. In cells, incubated in 3.85 mM glutamine medium (Gln), either β-oxidation was inhibited with 100 μM etomoxir (Etom), or ALDH activity was blocked with 50 μM DEAB. Then 16 μM HNE was added for 1h. TMRE fluorescence after 1h incubation with HNE was normalized to the fluorescence before HNE addition. For comparison controls without inhibitors are shown (25 mM glucose medium (Glc) or Gln). Data are presented as mean values ± SEM for 3-10 independent experiments. B. Effect of etomoxir (Gln+Etom), DEAB (Gln+DEAB) and 1 μM CCCP on the MMP of cells in glutamine medium without HNE. Etomoxir was also added to full medium (full medium+Etom) and to cells incubated in glucose medium (Glc+Etom). White bars are controls without inhibitor. Data are presented as mean values ± SEM for 3-12 independent experiments. C. NADH levels of cells incubated in medium containing different glucose (Glc) or glutamine (Gln) concentrations. NADH fluorescence was normalized to NADH fluorescence of cells incubated 2 h 30 min in 25 mM glucose medium. Data are presented as mean values ± SEM for 200 cells from 2 independent experiments. *p < 0.05, **p < 0.01.
