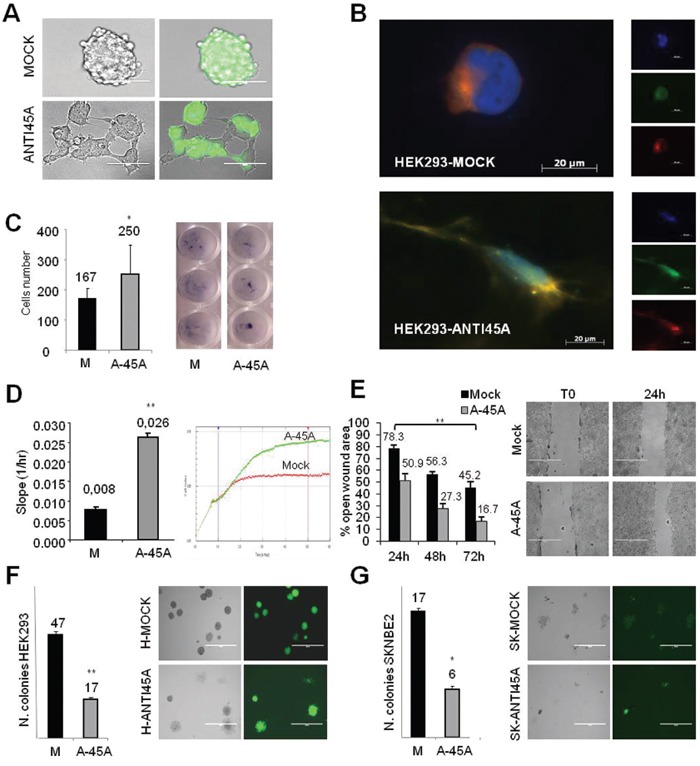
Figure 4. Cell morphology and migration potential after inhibition of 45A ncRNA.

A. Morphological analysis of colonies grown in adhesive condition of HEK-293-M and HEK-293-Anti45A cells. Right panels: GFP-positive colonies, as shown in the overlay picture. B. Morphological analysis of HEK-293-Mock and HEK-293-Anti45A permanently transfected cell lines, by ApoTome Microscope Technique from Carl Zeiss. Blue=DAPI, green=GFP, red=α-tubulin. C. Adhesion properties of HEK-293-Mock and HEK-293-Anti45A permanently transfected cell lines. Adherent cells were stained by methylene blue staining (right panel) and quantified by calculating the mean of cells counted in 3 independent wells (left panel). Data represent mean ± SD (*p < 0.05). D. Migration assay: using the xCELLigence RTCA DP Instrument (Roche), migratory capability of HEK-293-Mock and HEK-293-Anti45A cells has been quantified by the slope of the migration curve calculated by the RTCA 1.2 Software. Data represent mean ± SD (**p < 0.01). E. Wound healing assay: left panel shown quantitative analysis of open wound area percentage at different time point compared to T0 in HEK-293-Anti-45A and HEK-293-Mock cells; right panel shown representative image of open wound area (4x magnification). Results are representative for three independent experiments (mean ± SD, **p < 0.01). F. Capability of HEK-293 and G. SKNBE2 cells to form colonies in methylcellulose. Data represent mean ± SEM (*p < 0.05).
