
Figure 2. STAT3 binds and regulates genes in basal TNBC cell lines.
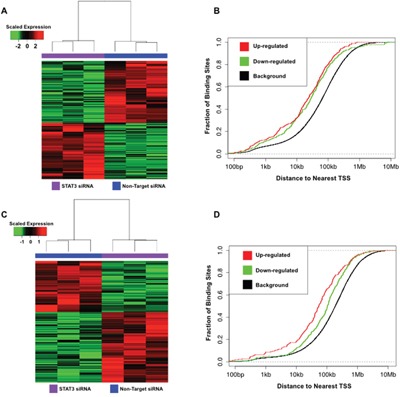
A. Heatmap of 737 differentially expressed gene transcripts in HCC70 in response to STAT3 knockdown (> 2.0-fold differences between siRNA treated cells and non-targeting vehicle controls) B. Cumulative distribution function plot of STAT3 binding sites near differentially expressed transcripts in HCC70. C. Heatmap of 548 differentially expressed gene transcripts in MDA-MB-231 in response to STAT3 knockdown (> 2.0-fold differences between siRNA treated cells and non-targeting vehicle controls) D. Cumulative distribution function plot of STAT3 binding sites near differentially expressed transcripts in MDA-MB-231.