
Figure 8. Paeoniflorin reduced interferon (IFN)-α-induced neuroinflammation in the ventral hippocampus.
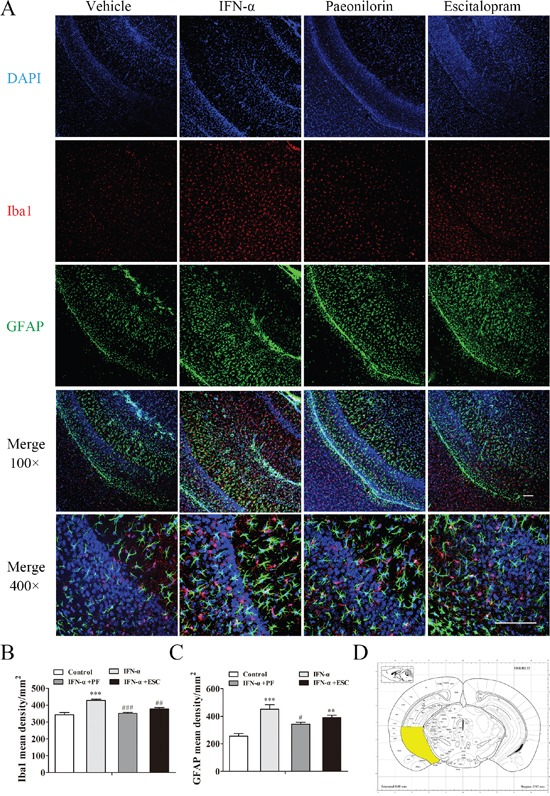
Immunofluorescenceco-staining of Iba1(red) and GFAP (green) after pretreatment with paeoniflorin (40 mg/kg i.g. daily for 4weeks) and systemic IFN-α administration (15×106 IU/kg s.c.) for 4 weeks. Nuclei are counterstained with DAPI (blue). A. Quantification of the number of activated Iba1-and GFAP-positive cells after IFN-α treatment using an observer-independent unbiased stereology approach. B, C. Immunoreactivity was evaluated for the microglial marker Iba1 and the astrocytic marker GFAP in the region of interest. The elevated activated microglia and astrocytes in the ventral hippocampus of IFN-α-injected mice were reduced by both paeoniflorin and escitalopram (10 mg/kg). The region of interest (the ventral hippocampus) is shown in the stereotaxic atlas of the mouse brain. D. Representative confocal microphotographs. Upper images: Iba1+GFAP+DAPI staining with an original magnification of ×100. Lower images:Iba1+GFAP+DAPI staining with an original magnification of ×400. Data are mean values ± SEM, evaluated by one-way analysis of variance followed by Tukey's post hoc tests (n=5 animals per group). *p< 0.05, **p< 0.01, ***p< 0.001 compared with the saline-treated group; #p< 0.05, ##p< 0.01, ###p< 0.001 compared with the IFN-α-treated group. Scale bar, 100 μm.