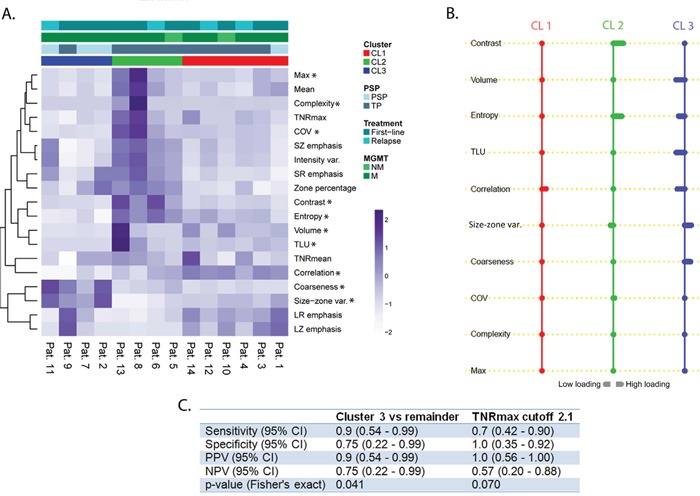
Figure 2.

A. Heat map with patients ordered with regard to their cluster membership. On the vertical axis, the 19 FET-PET features are ordered by hierarchical clustering to demonstrate their association with each cluster; PET feature values are given as z-scores. Pat., patient; PSP, pseudoprogression; TP, true progression; MGMT, O-6-methylguanine-DNA methyltransferase; NM, not methylated; M, methylated; * indicates that a features belongs to the 10 most relevant features; B. Results of nearest shrunken centroid method indicating high loadings on textural features for cluster 2. The reverse association is observed in cluster 3. Cluster 1 was solely associated with high loading on Correlation. A rightward deflection signifies high loadings on that feature whereas a leftward deflection signifies the opposite. Cl1, cluster 1; CL2, cluster 2; CL3, cluster 3; C. Performance of cluster 3 vs. TNRmax in detecting true progression. CI, confidence interval; PPV, positive predictive value; NPV, negative predictive value
