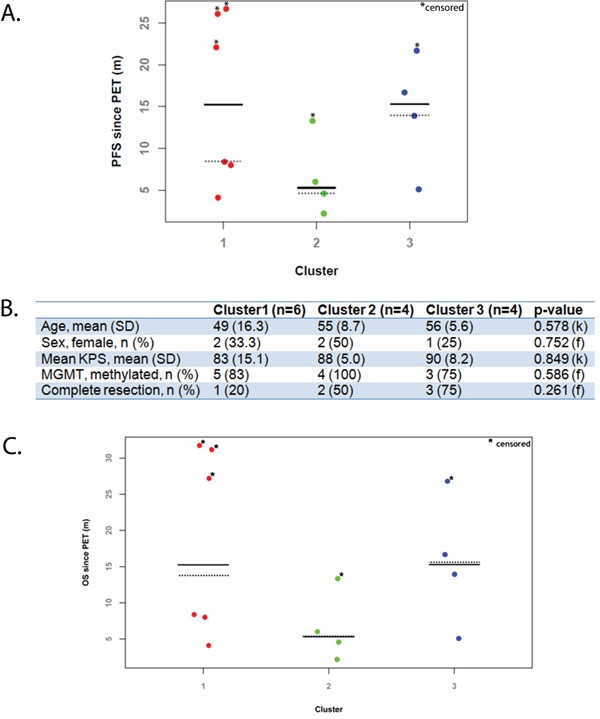
Figure 4.

A. Dot plot of progression-free survival (PFS) by cluster groups; B. Distribution of prognostic factors by cluster. C. Dot plot of overall survival (OS) by cluster groups; k, Kruskal-Wallis test; f, Fisher's exact test; MGMT, O-6-methylguanine-DNA methyltransferase; KPS, Karnofsky performance status, SD, standard deviation; n, number; Solid line indicates median PFS values; Dotted line indicates median PFS values measured by Kaplan-Meier method.
