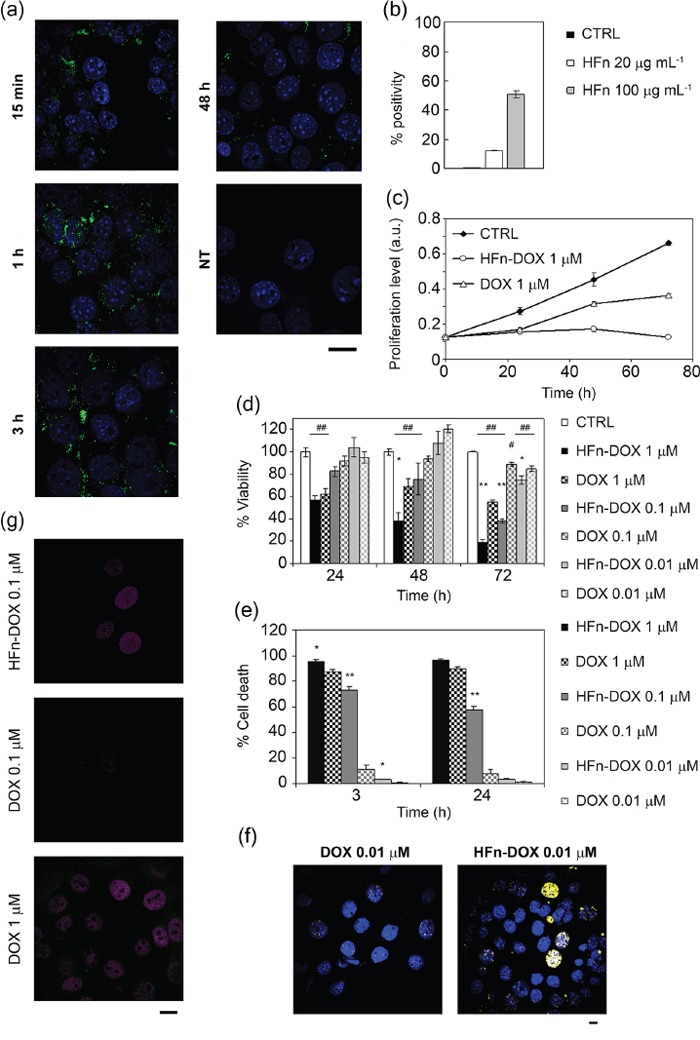
Figure 1. In vitro activity of HFn-DOX nanocages toward tumor cells.

a. Intracellular localization of HFn nanoparticles. Confocal microscopy merged images of 4T1-L cells, incubated for 15 min, 1, 3 and 48 h at 37 °C with 100 μg mL−1 of FITC-labeled HFn (green). Nuclei were stained with DAPI (blue). Scale bar: 10 μm. b. HFn binding toward 4T1-L breast cancer cells. 4T1-L cells were incubated 2 h at 4 °C with FITC-labeled HFn (20 and 100 μg mL−1) and then processed for flow cytometry. Untreated cells were used as control to set the positive region. c. Proliferation profiles of cells treated with 1 μM DOX or HFn-DOX for up to 72 h. Untreated cells are used as control. Values are mean of six replicates ± SE. d. Viability of cells treated with free or nanoformulated DOX. 4T1-L cells were treated with 1, 0.1, and 0.01 μM DOX or HFn-DOX for up to 72 h. Viability was assessed by measuring the conversion of MTT into formazan, normalized on cell proliferation of untreated cells. Statistical significance vs. CTRL #P<0.05, ##P<0.005; Statistical significance vs. DOX *P<0.01; **P<0.005. e. Cell death assay using DOX or HFn-DOX. 4T1-L cells were treated with 1, 0.1, and 0.01 μM DOX or HFn-DOX for 3 or 24 h. Cell death was assessed on the basis of the exposure to Annexin V, evaluated by flow cytometry. Untreated cells were used to set region of positivity. Values are mean of three replicates ± SE. Statistical significance vs. DOX *P<0.005; **P<0.0005. f. Double-strand break of DNA after DOX exposure. Confocal microscopy images of 4T1-L cells incubated with 0.01 μM DOX or HFn-DOX. Anti-γH2A.X antibodies were used to reveal the DNA double-strand breaks (DSB; yellow). Nuclei were stained with DAPI (blue). Scale bar: 10 μm. g. Doxorubicin release inside the nuclear compartment. Confocal microscopy images of 4T1-L cells incubated with 0.1 μM DOX or HFn-DOX and with 1 μM DOX for 3 h at 37 °C. DOX signal is represented in magenta, while DOX degradation product in green. Scale bar: 10 μm.
