
Figure 3. Bioavailability and tumor accumulation of HFn-DOX in comparison with free DOX.
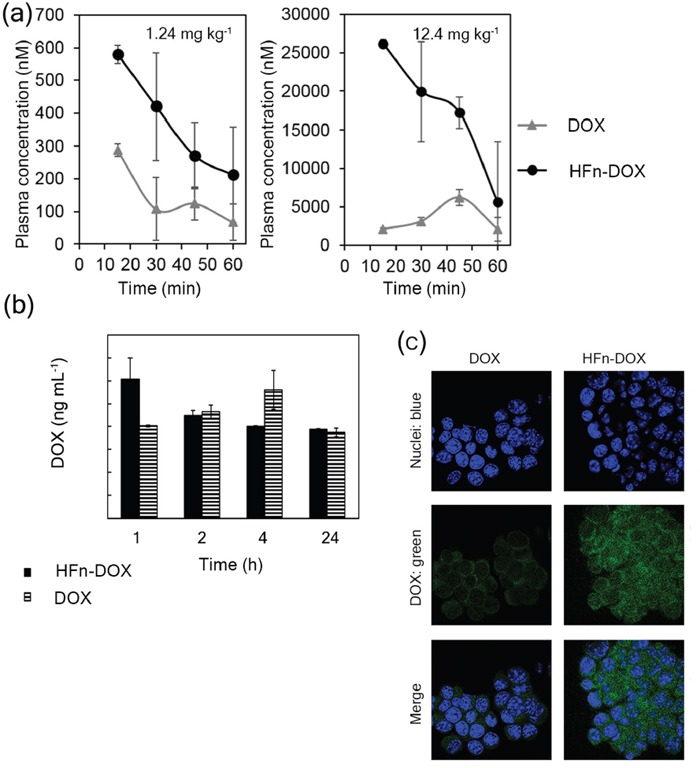
a. Bioavailability of DOX and HFn-DOX at different time points. Plasma concentration of DOX after i.v. injection of HFn-DOX (black circles) or DOX (gray triangles) at 1.24 mg kg−1 and 12.4 mg kg−1 in healthy mice. b. DOX accumulation at 4T1-L tumor in mice at different time points after administration of 1.24 mg kg−1 DOX as free molecule or HFn-DOX. Female Balb/C mice orthotopically implanted with 4T1-L murine mammary carcinoma cells were injected 6 days after implantation (time 0) with DOX or HFn-DOX. DOX levels in tumor have been determined 1, 2, 4, and 24 h after i.v. injection following acidified isopropanol extraction from tumor homogenates. Aliquots from six mice per each time point concentration have been extracted and analyzed by spectrofluorimeter. Reported values are means of 3 samples/group ± SE. P values are summarized in Table S5. c. Confocal microscopy images of 4T1-L cells dissociated from tumor harvested 2 h after i.v. injection of DOX and HFn-DOX. DOX signal is represented in green, while nuclei were stained with DAPI (blue). Scale bar: 10 μm.