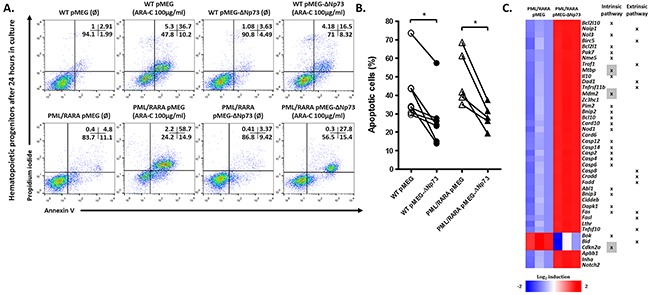
Figure 2. Drug-induced apoptosis assay.

A. Representative example of one out of five independent experiments of apoptosis using Ara-C 100μg/ml as standard stimulus for apoptosis. B. Percentage of apoptotic cells after 24h in culture after apoptotic stimulus. C. Fold induction upon Ara-C treatment of the top genes differentially expressed in hCG-PML-RARA cells overexpressing or not the ΔNp73. Genes related to intrinsic or extrinsic pathways are indicated. Genes highlighted in gray represent those related to cell cycle control. (Ø) represents non treated samples. * indicates P < 0.05.
