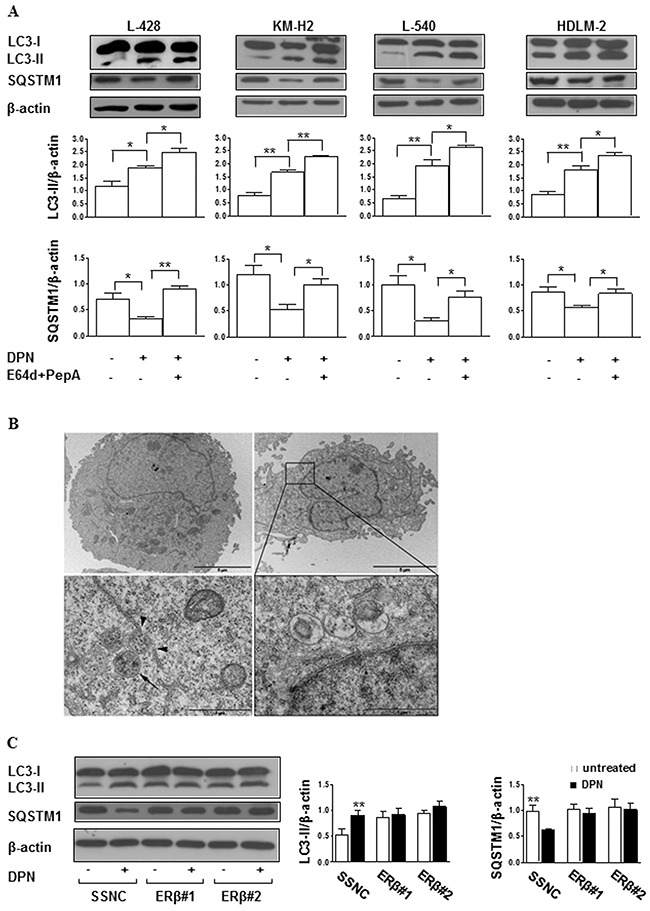
Figure 2. DPN induces autophagy in HL cells.

A. Western blot analysis of the autophagic markers LC3-II and SQSTM1 in cell lysates from L-428, KM-H2, L-540, and HDLM-2 cells treated or not with 10 nM DPN for 24 hours, in the presence or absence of the lysosomal inhibitors E64d and PepA. For each cell line, blots shown are representative of 3 independent experiments (top). Densitometry analysis of specific protein levels relative to β-actin is also shown (bottom). Values are expressed as mean ± SD; *, p < 0.05 and **, p < 0.01 versus untreated cells. B. TEM analysis performed on L-428 cells treated or not for 24 hours with 10 nM DPN and observed by a Philips 208 electron microscope at 80 kV, equipped with Mega Wiew II, Olympus soft imaging solutions. The images were acquired by the specific software ITEM tem imaging platform. In the top panels (at magnification of 6300x) untreated (left) and DPN-treated (right) cells are shown. When observed at a higher magnification (32000x, bottom panels), DPN-treated cells displayed several autophagic vacuoles (left) as well as autophagolysosomes (right). To note, autophagic vacuoles showing the characteristic double membrane (arrow) appeared to be close to endoplasmic reticulum (arrowheads, left). Results from one representative experiment out of 3 are shown. C. Western blot analysis of LC3-II levels in cell lysates from L-428 cells transfected with Silencer Select Negative Control (SSNC) or ERβ siRNA (ERβ#1 and ERβ#2) and treated or not with 10 nM DPN for 24 hours. Blots shown are representative of 3 independent experiments (left). Densitometry analysis of LC3-II levels relative to β-actin is also shown (right). Values are expressed as mean ± SD. **, p < 0.01 versus untreated cells.
