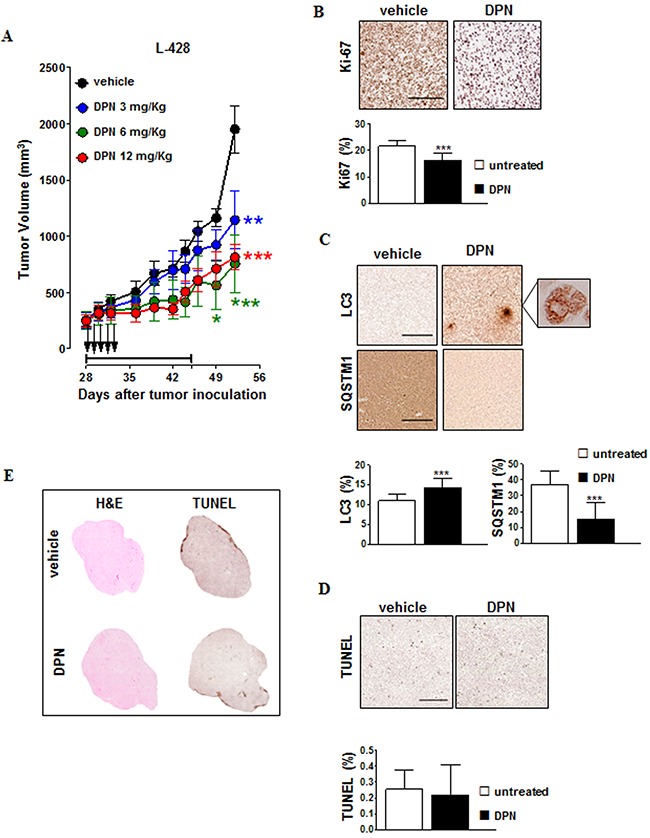
Figure 3. DPN induces growth inhibition and autophagy in HL xenografts in NOD/SCID mice.

A. NOD/SCID mice bearing 100-mm3 L-428 tumor nodules were randomly assigned to receive 15-day treatment with DPN by intraperitoneal injection 5 days/week for 3 weeks (3 mg/kg, blue; 6 mg/kg, green; 12 mg/kg, red) or vehicle control (black). Black arrows indicate DPN treatment administration, whereas treatment duration is indicated by horizontal capped black line (days 28-46). The mean (± SEM) tumor volumes are shown. *, p < 0.05; **, p < 0.001; ***, p < 0.0001 compared with the vehicle controls. B. Ki-67 and C. LC3 and SQSTM1 staining of L-428 tumors treated with DPN (12 mg/kg/day, 5 days) or vehicle control. In Ki-67-, LC3-, and SQSTM1-stained sections brown staining represents a positive signal within the tumor (top). Objective lens, 0.75 numerical aperture (NA) dry objective; original magnification, 20x. Scale bar, 100 µm. Enlarged picture (500x) shows localized distinct puncta (C). For each parameter, data are also represented as mean ± SD (bottom). Results are calculated as mean from 15 microscope fields for each sample, 3 mice per group. Images were analyzed using Image-Pro Analyzer software. Original magnification 20X. Statistical analysis: *, p < 0.001. D. In L-428 tumors treated with DPN (12 mg/kg/day, 5 days) or vehicle control, apoptotic tumor cells were detected by TUNEL staining and were revealed as brown nuclei using 3,3’-diaminobenzidine for light microscopy analysis (top). Objective lens, 0.08 NA dry objective; original magnification, 20x. Scale bar, 50 µm. Digitally acquired TUNEL stained sections were analyzed using ImageJ for quantification of the apoptotic percentage (mean ± SD, bottom). At least three sections from different animals were analyzed. E. Representative histological images of entire tumor sections from L-428 tumors treated with DPN (12 mg/kg/day, 5 days) or vehicle control. Tumor tissue morphology was detected via hematoxylin and eosin (H&E) staining. The tumor necrotic areas were detected via TUNEL staining and were visualized as brown. Objective lens, 0.08 NA dry objective; original magnification, 2x.
