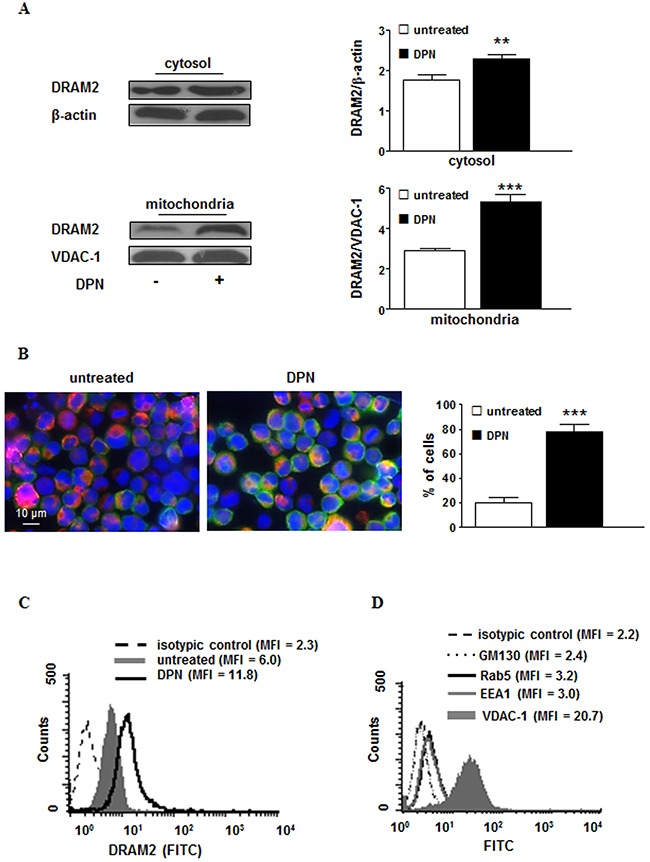
Figure 4. Cellular expression and localization of DRAM2 in HL cells after DPN treatment.

A. Western blot analysis of DRAM2 levels in cytosolic and mitochondrial fractions obtained from L-428 cells treated or not with 10 nM DPN for 24 hours. Blots shown are representative of 3 independent experiments (left). Densitometry analysis of DRAM2 levels is also shown. Values are expressed as means ± SD. **, p < 0.01; ***, p < 0.001 versus untreated cells (right). B. Immunofluorescence analysis of DRAM2 (green staining) distribution in mitochondria (red staining) in untreated (left) or 10 nM DPN-treated (right) L-428 cells for 24 hours. Cells were stained with Hoechst dye to reveal nuclei (blue staining) and observed by a scanning confocal laser microscope, with an objective of 60× with numeric aperture of 1.4. The images were acquired by the specific software IAS 2000. The percentages of cells in which DRAM2 localized at mitochondrial level are also shown and expressed as mean ± SD of the results obtained from 3 independent experiments. C. Representative flow cytometry analysis of purified mitochondria from L-428 cells treated or not with 10 nM DPN for 24 hours after staining with anti-DRAM2 monoclonal antibody. Broken line, isotype control staining; grey solid curve, DRAM2-labeled mitochondria from untreated cells, and black line, DRAM2-labeled mitochondria from 10 nM DPN-treated cells. D. Representative flow cytometry analysis of mitochondria preparation after staining with monoclonal antibodies to GM130 (dotted line), Rab5 (black line), EEA1 (grey line) or VDAC-1 (solid grey curve), to test its degree of purity. The isotype control is represented by the broken line. Results from one representative experiment out of 5 are shown. MFI, mean fluorescence intensity.
