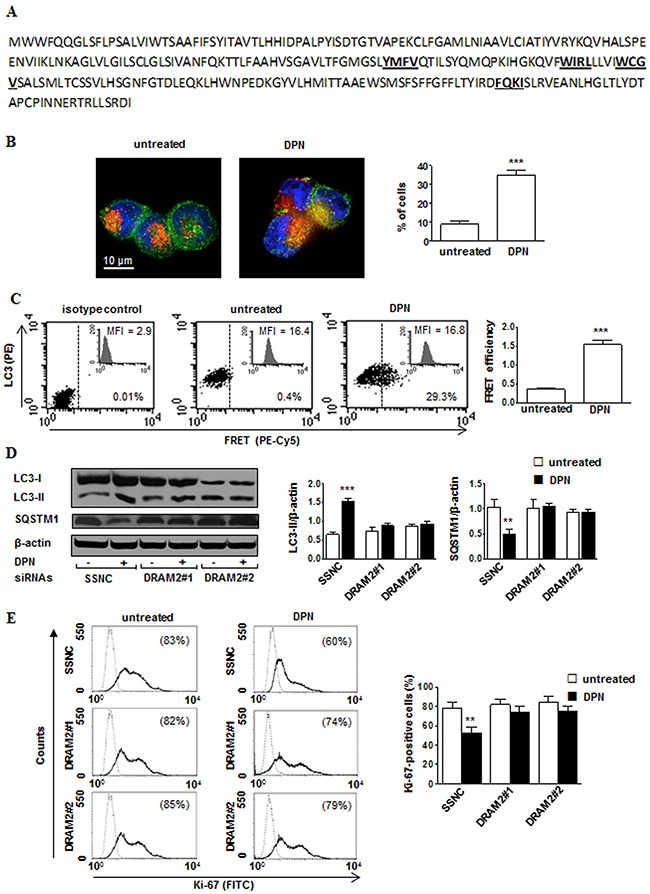
Figure 5. DPN-mediated induction of autophagy and inhibition of proliferation is mediated by DRAM2 in HL cells.

A. DRAM2 amino acid sequence. W/F/Y-x-x-L/I/V consensus sequence for the core LIR motif are underlined and bold. B. Immunofluorescence analysis of LC3 (green staining) and DRAM2 (red staining) from untreated (left) or 10 nM DPN treated (right) L-428 cells for 24 hours. Cells were counterstained with Hoechst dye to reveal nuclei (blue staining) and observed by a scanning confocal laser microscope with an objective of 60× with numeric aperture of 1.4. The images were acquired by the specific software IAS 2000. The percentages of cells in which LC3/DRAM2 co-localized occurres are shown and expressed as mean ± SD of the results obtained from 3 independent experiments. C. Representativeflow cytometry analysis of DRAM2 - LC3 association by FRET technique in untreated (middle) and 10 nM DPN treated (right) cells for 24 hours. DRAM2 protein was detected in FL4 channel (Cy5), LC3 in FL2 channel (PE), and FRET in FL3 channel (PE-Cy5). Isotype control is shown in left panel. Numbers indicate the percentage of FL3-positive events. Mean fluorescence intensity (MFI) is referred to DRAM2 expression. Bar graph shows the evaluation of FRET efficiency (FE), according to the Riemann algorithm of DRAM2-LC3 association. Results represent the mean ± SD from 3 independent experiments. ***, p < 0.001 versus untreated cells. D. Western blot analysis of LC3-II and SQSTM1 levels in cell lysates from L-428 cells transfected with Silencer Select Negative Control (SSNC) or DRAM2 siRNAs (DRAM2#1 and DRAM2#2) treated or not with 10 nM DPN for 24 hours. Blots shown are representative of 3 independent experiments (left). Densitometry analysis of LC3-II and SQSTM1 levels relative to β-actin is also shown (right). Values are expressed as means ± SD. **, p < 0.01; ***, p < 0.001 versus untreated cells. E. Cell proliferation was evaluated by flow cytometry measuring Ki-67 nuclear antigen expression in L-428 cells transfected with SSNC or DRAM2 siRNA (DRAM2#1 and DRAM2#2) treated or not with 10 nM DPN for 48 hours. Results from one representative experiment out of 3 are shown (left). Data are also reported as mean ± SD (right), **, p < 0.01 versus untreated cells.
