
Figure 9. The level of FOXM1 and ABCC10 are correlated in CRC patient tissues.
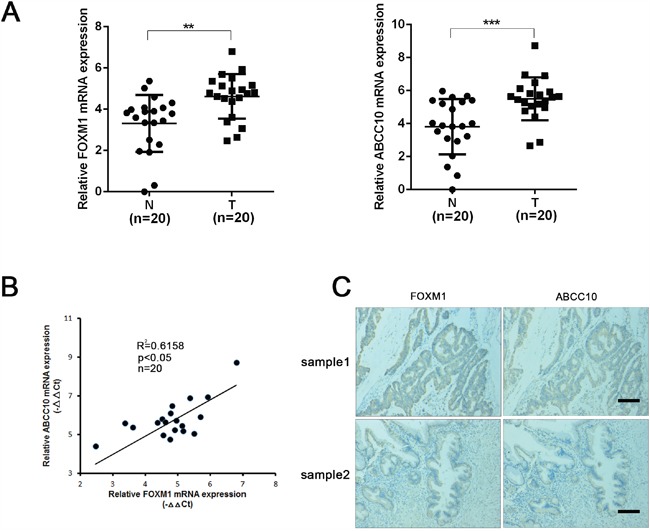
A. qRT-PCR assay of FOXM1 and ABCC10 in 20 paired CRC and nontumor tissues. The FOXM1 and ABCC10 expression was normalized to β-actin (ΔCt) and compared with the maximum ΔCt. Data were presented as -ΔΔCt. B. The bivariate relation between the transcription levels of FOXM1 and ABCC10 in 20 CRC tissues assessed by Pearson's correlation test. C. Representative immunostaining of FOXM1 and ABCC10 in consecutive sections of CRC patient tissues (scale bar, 100μm). Statistical significance was determined by Student's t test. *p<0.05, **p<0.01, ***p<0.001.