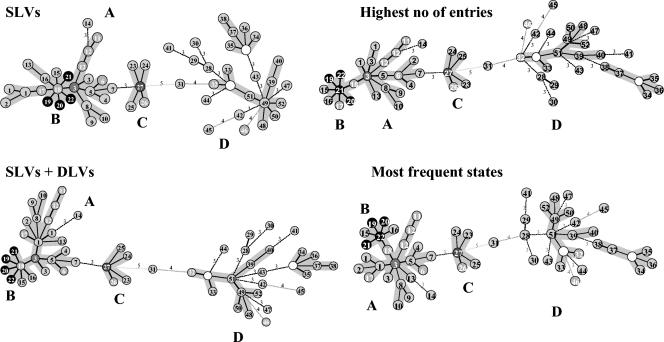
FIG. 3.
Salmonella population modeling. The number in each circle indicates the genotype identified in Table 3. The number of isolates for a given genotype is arbitrarily visualized by different cell shadings or fonts: gray or black, one isolate; sequential increase in shading from gray to black circles with white numbers, two, three, four, and five or more isolates. The empty circle indicates a hypothetical genotype not present in the population analyzed. The distance between neighboring genotypes is expressed as the number of allelic changes and is outlined by different shapes of lines: short bold line, one change; long thin line, two changes; black dotted lines, three to five changes, as indicated.

