
Figure 1. The misuse of cytotoxicity assays.
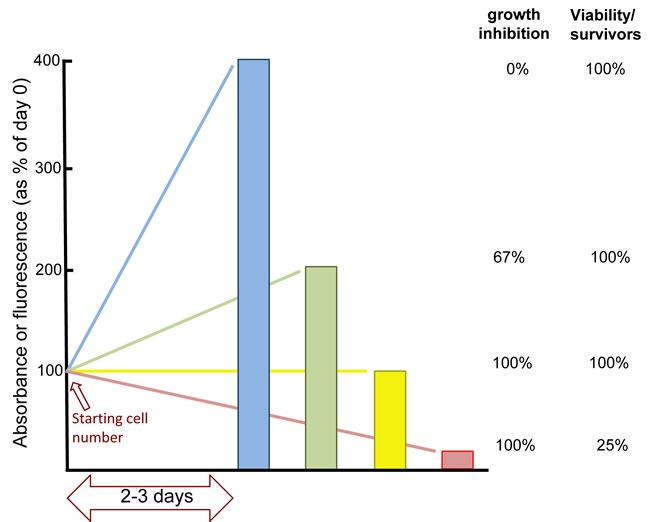
Because of its ease of application to multiple samples, and its low cost, tetrazolium dye reduction assays such as “MTT” or MTS” (available from many companies) are frequently used. This assay measures primarily mitochondrial dehydrogenase activity that is then extrapolated to reflect the number of cells in a culture dish. However, cells can rapidly change the activity of these enzymes such that it may not be an accurate reflection of the cell number. The CellTiter-Glo assay (Promega) relies on changes in ATP levels that can fluctuate rapidly with many environmental stresses so may not reflect the number of viable cells. Alternate assays measure total cell protein yet arrested cells can markedly increase their protein content without dividing, while dead cells still have protein. In our own experiments, we routinely quantify DNA content for high throughput assays as the possible variation per cell is generally limited to only 2 fold (i.e., whether the cells are in G1 or G2 phase of the cell cycle) [14, 21]. However, the major problem with all these assays it that they are almost ubiquitously referred to as viability assays when none of them measure cell viability. In an ideal situation where mitochondrial enzymes, ATP or DNA levels do not change per cell, these assays still only measure the number of viable cells. Consider a typical cytotoxicity experiment performed in a 96 well format. If you plate 1000 cells on day 1, the control may have 2000 cells on day 2 and 4000 cells on day 3 (blue line). If drug treatment results in 2000 cells on day 3 (green line), this is often reported as 50% viability even though it is an increase over the starting number of cells. To express the increase, it is necessary to subtract the starting cell number, so the increase from 1000 to 2000 actually reflects 67% growth inhibition (because the control increased by 3000). If the treated cells have completely arrested, there are still 1000 cells on day 3 (yellow line). In this case, the results will often be reported as “25% viability” even though there may be 100% growth inhibition and no loss of viability (albeit there is likely a mixture of dying and growing cells at this concentration). If the drug is not killing any cells, it will not cure the tumor, so a conclusion that only 25% of the cells are viable - implying 75% have died - would provide inappropriate optimism for a potential new therapeutic agent or strategy. If there were only 250 cells on day 3, this would indeed represent loss of viable cells (red line). However, this decrease in viable cell number can not be realized unless the starting number of cells is subtracted from the results. Unfortunately, few people measure the signal on day 1. Examples of curves from actual experiments of cell growth and death are presented in Figure 2.