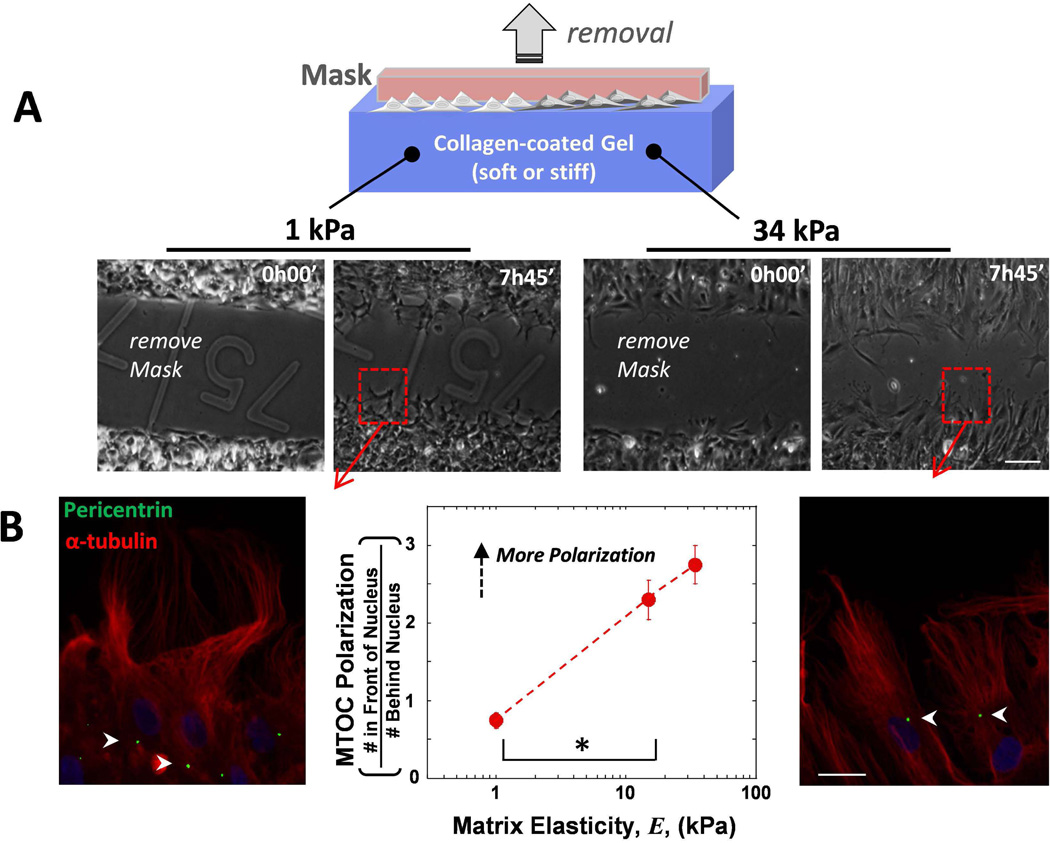
Fig. 1. MTOC polarization increases with increasing gel stiffness in MSCs migrating in wound assays.
(A) The mask was removed at the initial time and the Mesenchymal stem cells (MSCs) migrate into the 500 µm wide gap on gels of varying stiffness. Scale bar 100 µm (B) The MTOC was visualized with pericentrin (green), the MTs with α-tubulin (red) and DNA with Hoechst (blue) 2 hours after migration. MTOC polarization was quantified as (# In Front of the Nucleus)/(# Behind Nucleus). A ratio of 1 indicates as many cells have the MTOC in the front as the back. Arrowheads indicate location of MTOC. Scale bar 20 µm. N=3, n≥91 cells, * p<0.05. Error bars SEM.

