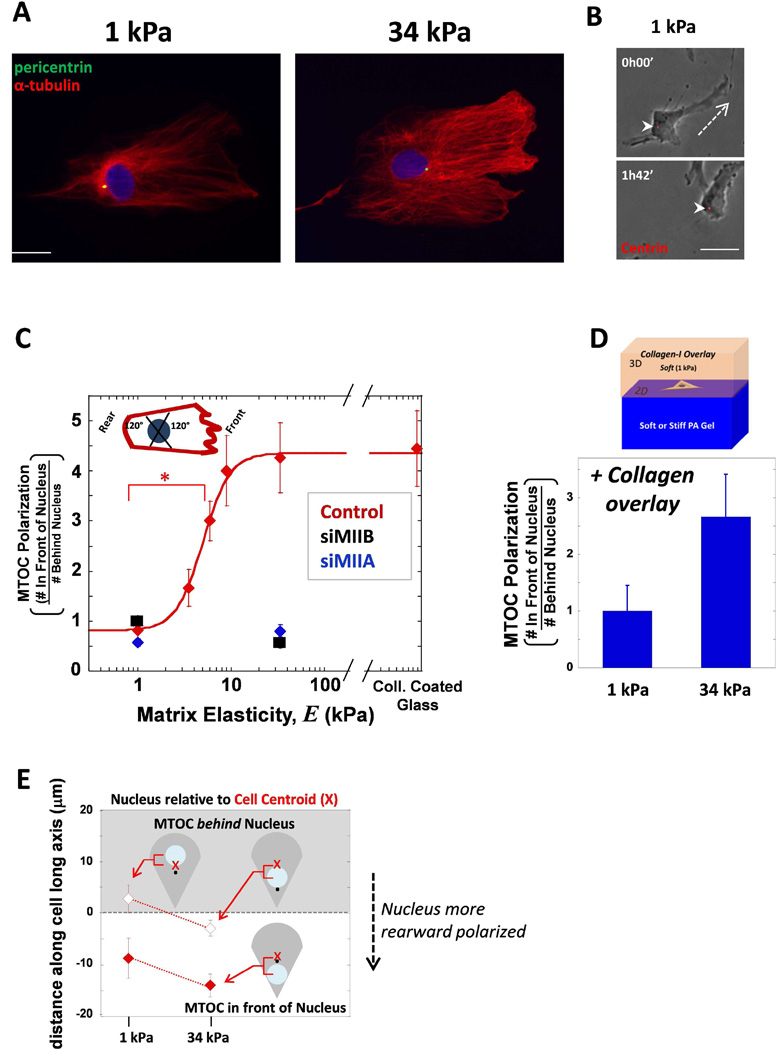
Fig. 2. MSCs polarize their MTOC on sufficiently stiff matrix during migration as single cells.
(A) Cells on either soft 1 kPa or stiff 34 kPa matrix were immunostained for pericentrin (green) and MTs (red) and DNA with hoechst (blue). Scale bar 20 µm. (B) Cell transfected with dsRed-Centrin was imaged migrating on soft 1 kPa matrix. The MTOC was located behind the nucleus during migration. Dashed line indicates direction of migration, arrowheads point to MTOC. Scale bar 20 µm (C) The ratio of the number of cells with MTOC in front of nucleus to the cells that have the MTOC behind nucleus. A schematic picture represents how the MTOC was considered in a ‘front’ or ‘rear’ position based on the migrating phenotype of a lamellipodium in the front and a tail in the rear. When MIIA (blue) or MIIB (black) is depleted, the MTOC fails to polarize to the cell front despite being on stiff matrix. Error bars SEM. N=3, n≥25, * p<0.05. (D) For PA gel stiffnesses of 1 and 34 kPa, a soft collagen was overlaid on top of the gel and the cells migrating on the surface were assessed for MTOC polarization. (E) The data from (C) was separated so that the instances the MTOC was in front of the nucleus (white background, filled shapes) was separated. The average distance between the cell centroid and the nucleus center was plotted and again the instances when the MTOC was behind the nucleus was differentiated from when it was behind. The nucleus was more rearward positioned in cells on stiffer matrix as the nucleus move closer to the rear.

