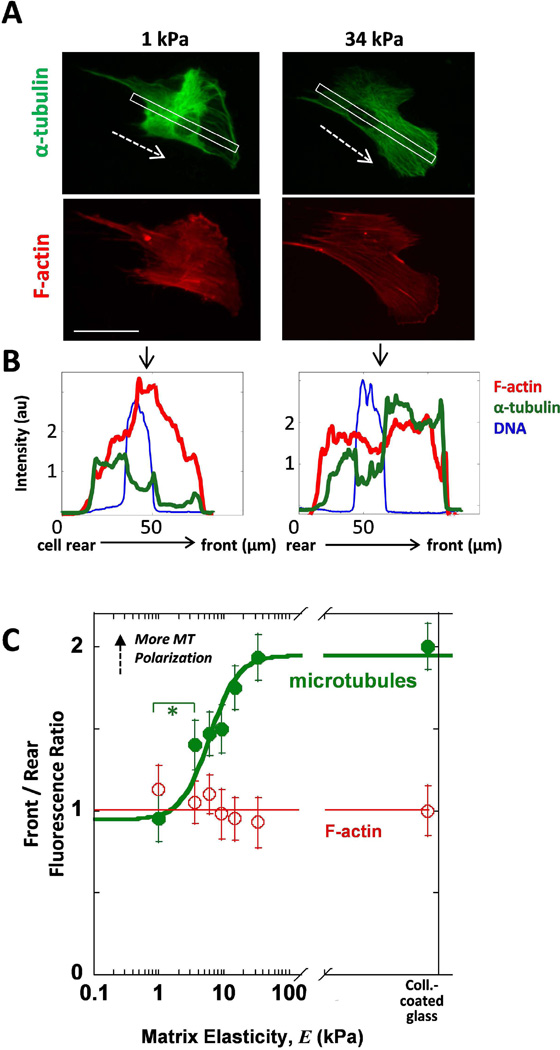
Fig. 3. Stiff matrix promotes frontward distribution of MTs.
(A) Images of MSCs on soft or stiff gels show higher MT density in front of the nucleus with stiff matrix but not when on soft matrix. White outline indicates the region scanned for the line scans of fluorescence intensity. Dashed arrows indicate inferred direction of migration.. Scale bar = 50 µm. (B) Line scans taken from the back to the front of the cell show the intensity of MT density (green) as well as the nucleus (blue) and F-actin (red) as a function of distance. (C) The Front/Rear fluorescence is quantified as the ratio of the front half of the cell over the rear half on either side of the nucleus. The ratio for F-actin is plotted vs matrix elasticity and is compared to MTs. MTs polarize to the front of the cell with increasing matrix stiffness. Error bars SEM from N=3, n≥43, * p<0.05.

