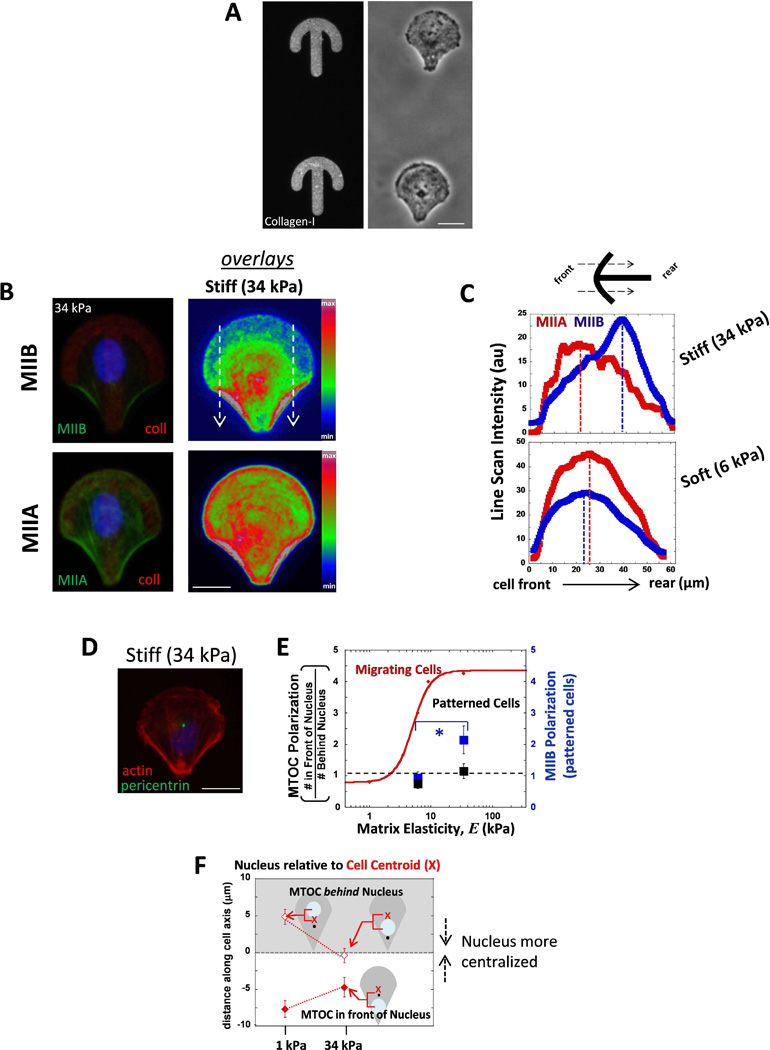
Fig. 5. MSCs confined to polarized patterns exhibit myosin-IIB polarization on stiffer matrix, but MTOC polarization in front of the nucleus is not present either soft and stiff matrix.
(A) Gels with micropatterned collagen-I in polarized crossbow shapes (stained with an antibody). Phase contrast images of MSCs on the micropatterned gels. Scale bar 20 µm. (B) Sample image of cellular distributions of MIIB and MIIA in a cell on stiff (34 kPa) gels. False color represents an overlay of MIIB (top) or MIIA (bottom) staining. White arrows indicate the direction of the scan used as the region of interest in C. Scale bar 20 µm. (C) Distributions of MIIB and MIIA on stiff and soft patterned gels by taking scans of the ROI shown in B from the cell front to cell rear. MIIB is more polarized to cell rear only on stiff patterns. MIIA is not polarized to cell rear in cells on either stiffness (D) MTOC positioning in cells on patterned gels. Scale 20 µm. (E) Summary plot that compares the difference in MTOC polarization between migrating cells (red, from Fig. 2C) and patterned cells (black) and also MIIB polarization for patterned cells (blue). Patterned cells polarize MIIB with increasing matrix stiffness but MTOC polarization in front of the nucleus does not occur with increasing stiffness. * p<0.05 N=2, n≥15. (F) The positioning of the nucleus relative the cell center. The data is divided for cells that displayed MTOC behind the nucleus (open points, gray background) from cells that had the MTOC in front of the nucleus (filled in points, white background). The nucleus is more randomly positioned on soft matrix, while more centered on stiff.

