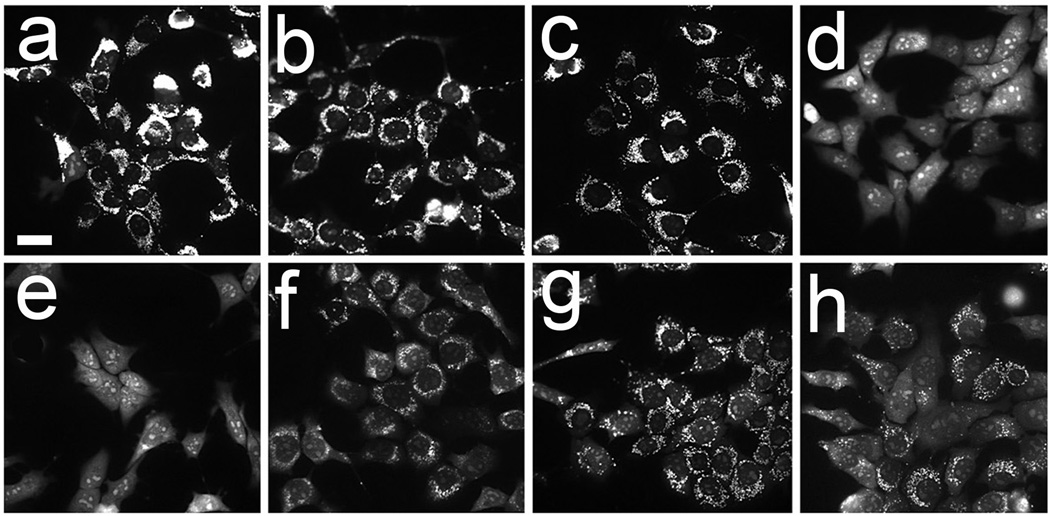
Figure 3.
Loss of ΔΨm directly after photodamage: a, untreated control; b, BPD alone; c, NPe6 alone; d, sequential PDT NPe6 → BPD, no gap, e, 3 min gap, f, 10 min gap, g, 30 min gap; h, 30 min gap with cells held at 15°C. Light and drug doses are specified in the text. These images represent results of experiments that were repeated 3 times. White bar in panel a = 20 µm.

