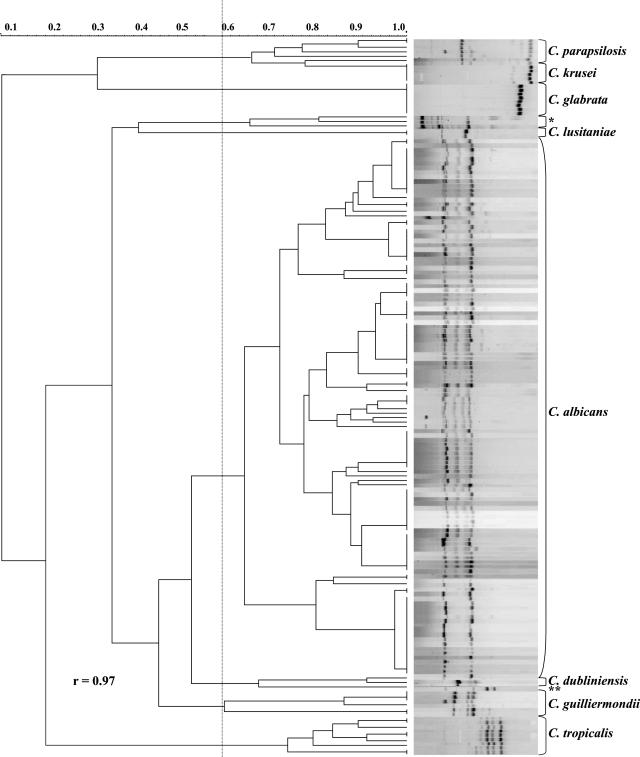
FIG. 4.
Dendrogram showing the degree of similarity of T3B fingerprinting profiles among the clinical Candida isolates by using the Dice coefficient and UPGMA cluster method. The unidentified strains are indicated as follows: *, 36 M, 65 M, and 66 M; **, 153 M. An arbitrary line has been drawn at 0.58 delimitating the major groups. r, cophenetic correlation coefficient.

