
Figure 3. OA-NO2 initiates an anti-inflammatory response with cytoprotective responses.
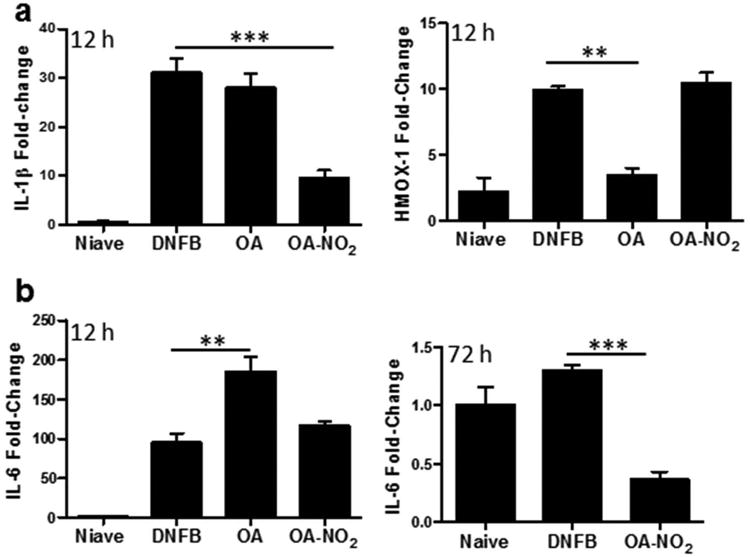
Graphs demonstrate the relative fold change in mRNA expression of (a) IL-1β and HMOX-1 at 12 h following elicitation and (b) IL-6 at 12 h (left panel) and 72 h (right panel). Fold-change was determined using the relative qRT-PCR 2-ΔΔCt method. The bar indicates the mean of three mice for each treatment group. One representative of two independent experiments. Asterisks indicate a significant difference compared to DNFB treatment alone, as indicated, **=p < 0.01, ***= p < 0.001.