
Figure 4. OA-NO2 enhances immune regulatory responses.
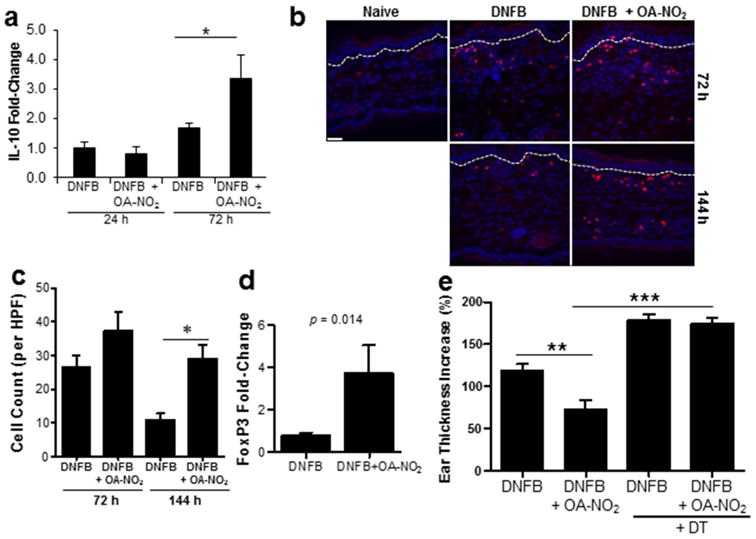
CHS was induced with DNFB ± OA-NO2. (a) Bars represent the mean relative fold-change in IL-10 mRNA expression ± SEM of 3 mice per group, 24 and 72 h following elicitation. (b) 72 and 144 h following elicitation ears were immunofluorescently labeled with FoxP3-specific antibodies (red) in addition to DAPI nuclear counterstain (blue). Dashed line indicates epidermal-dermal junction. Scale bar = 50 μM. (c) FoxP3+ cells were quantitated. Bars represent the mean ± SEM of 3 mice, 7-10 independent high powered fields per mouse were averaged. (d) FoxP3 transcripts were assessed 144 h following elicitation. Bar indicates the mean of each treatment group ± SEM of 3-5 mice. Significance value is indicated. (e) CHS was induced in FoxP3DTR mice ± OA-NO2. Bars represent the mean increase in ear thickness at 48 h ± SEM of 4-5 mice. One representative of two individual experiments for each study. Asterisk indicates a significant difference between the indicated treatment groups, *= p < 0.05, **= p < 0.01, and ***= p < 0.001.