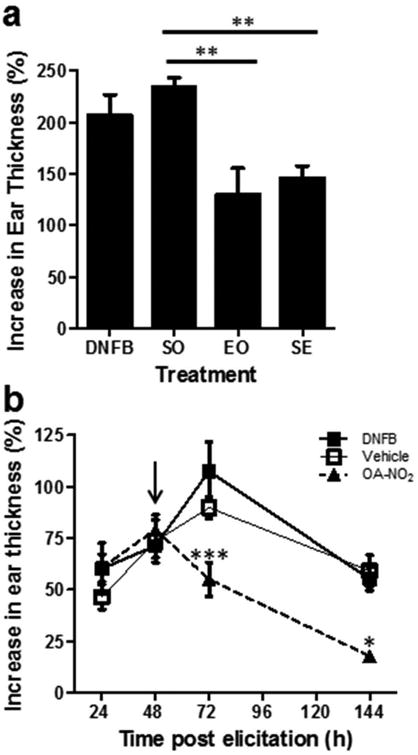
Figure 5. OA-NO2 treatment suppresses established CHS.

(a) CHS was induced with DNFB ± OA-NO2 administered during sensitization only (SO), elicitation only (EO), or during sensitization and elicitation (SE). Bars represent the mean increase in ear thickness ± SEM of 4-5 mice per group at 144 hr post-elicitation. Asterisks indicate a significant difference between indicated groups, ** = p < 0.01. (b) CHS was induced in mice with 0.5% DNFB. 48 h following elicitation (arrow), groups of mice received OA-NO2, vehicle control, or were untreated. Each data point represents the mean increase in ear thickness ± SEM of 3-5 mice. Asterisk indicates a significant difference compared to DNFB treatment group, * = p < .05 and *** = p < 0.001. Both data sets are one representative of three independent experiments each.
