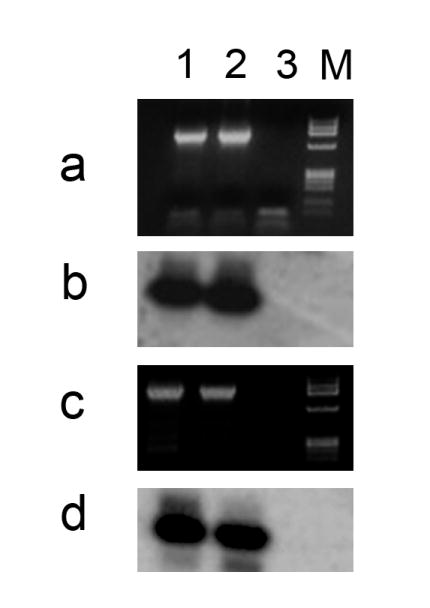
Figure 7. Conventional RT-PCR analyses on the expression of TPM 2α and TPM 3α in heart and skeletal muscle.

Panel a: Ethidium bromide staining of the PCR products amplified with TPM3α specific primer-pair as shown in Table 1.
Panel b. Southern hybridization of the TPM3α amplified DNA with TPM3α specific probe (5′-GCACATTGCTGAGGAGGCTGACCGC-3′).
Panel c. Ethidium bromide staining of the PCR amplified DNA with TPM2α specific primer-pair as given in Table 1.
Panel d. Southern hybridization of the TPM2α amplified DNA with TPM2α specific probe (5′-GATTCTTGAGGGTGAGCTTGAGC-3′).
Lanes 1: Heart; Lane 2: Sk muscle; Lane 3: Primer-control
Note that TPM2α and TPM3α transcripts are expressed both in heart and skeletal muscle.
