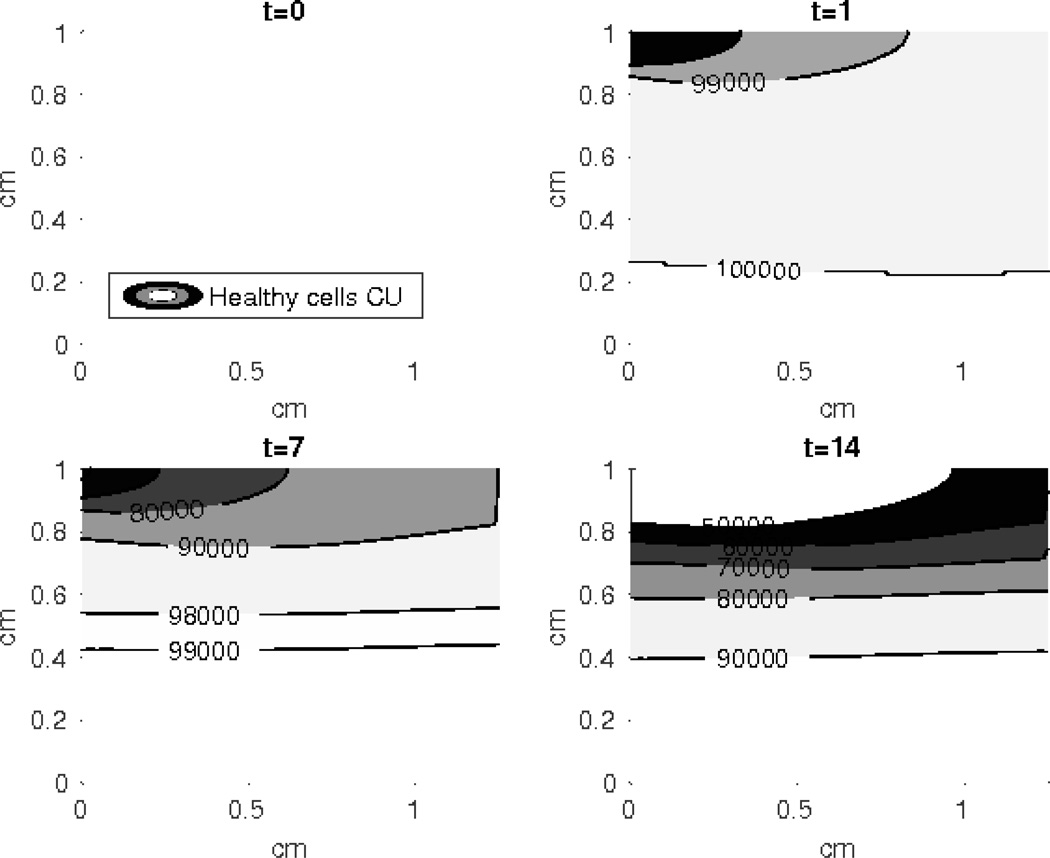
Figure 2. Contour plot of the healthy unsignaled cells (CU).
The density of the CU cells reduces more rapidly at the top of the simulated cartilage explant and the effect of the external loading diminishes at the bottom layers. The horizontal axis is radius of the cylindrical explant, and the vertical axis is depth.

