
Figure 1.
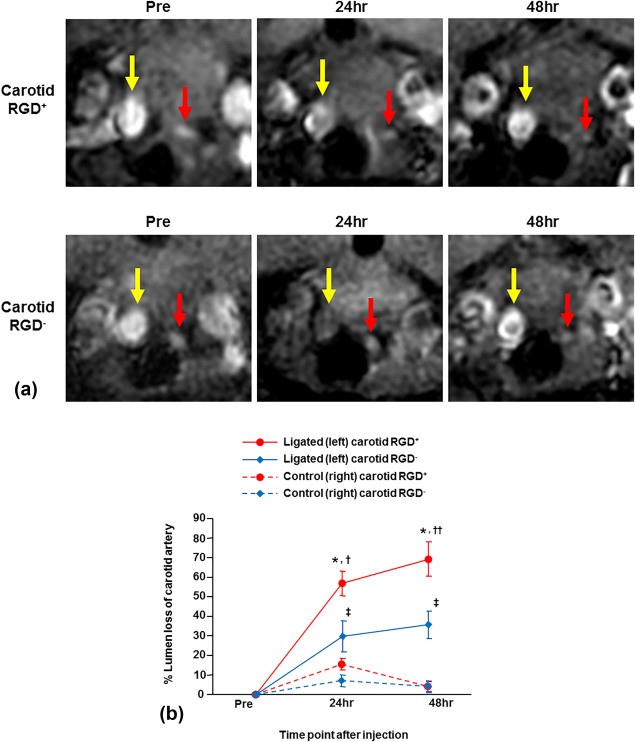
Serial in vivo MRI of carotid arteries with RGD‐HFn‐Fe3O4 or HFn‐Fe3O4. A: The ligated left carotid arteries (red arrows) were smaller than the nonligated right carotid arteries (yellow arrows) prior to RGD‐HFn‐Fe3O4 or HFn‐Fe3O4 injection (Pre). After the injection, signal loss of the ligated left carotid artery was seen at 24 and 48 hours in both RGD+ and RGD– mice, but was greater in RGD+ mice. Luminal area reduction was not seen in the control (nonligated) right carotid artery in either group. B: By quantitative analysis, the ligated left carotid artery showed significant percent reduction in lumen area (% lumen loss) at 24 and 48 hours in both RGD+ and RGD– groups, but the % lumen loss of RGD+ group was significantly greater. The control right carotid artery showed minimal % lumen loss in both groups. *P < 0.001 vs. Pre, P < 0.001 vs. right carotid, †P = 0.02 vs. RGD– group, ††P = 0.01 vs. RGD– group, ‡P < 0.05 vs. Pre, P < 0.05 vs. right carotid.