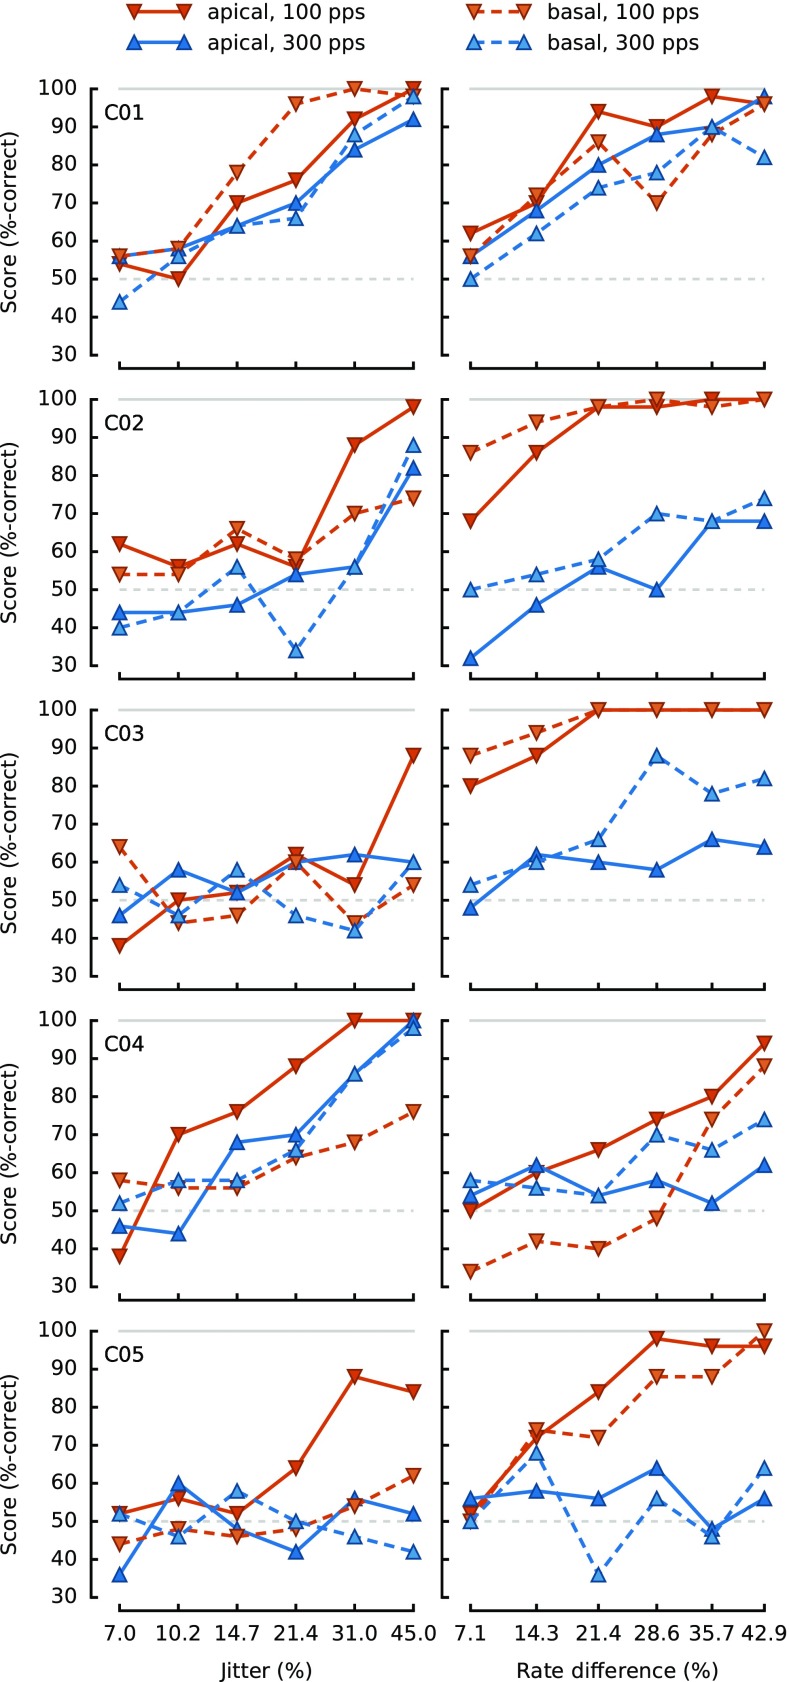
FIG. 2.
Individual CI data for jitter detection (left column) and rate discrimination (right column). The lower base rate (100 pps) is marked with downward pointing triangles (red), while the higher base rate (300 pps) is marked with upward pointing triangles (blue). The apical excitation site is traced with a solid line, while the basal excitation site is traced with a dashed line.

