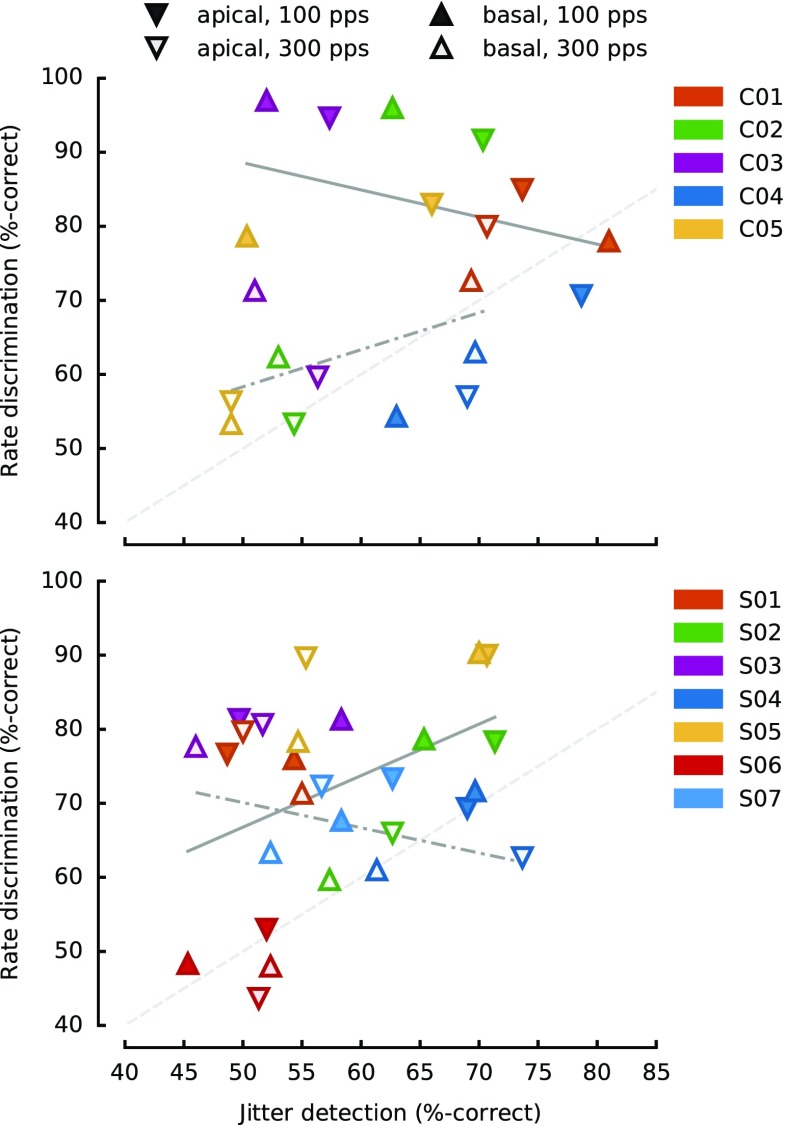
FIG. 4.
Correlations between jitter detection and rate discrimination for CI (top panel) and NH (lower panel) listeners. Unlike in Figures 2 and 3, the downward pointing symbols represent the apical site, while the upward pointing symbols represent the basal site. The opened symbols correspond to the 300-pps base rate, while the filled symbols correspond to the 100-pps base rate. Each participant is plotted with a different colour. The grey lines show the regression lines for the 100-pps base rate (solid) and for the 300-pps base rate (dot-dashed).

