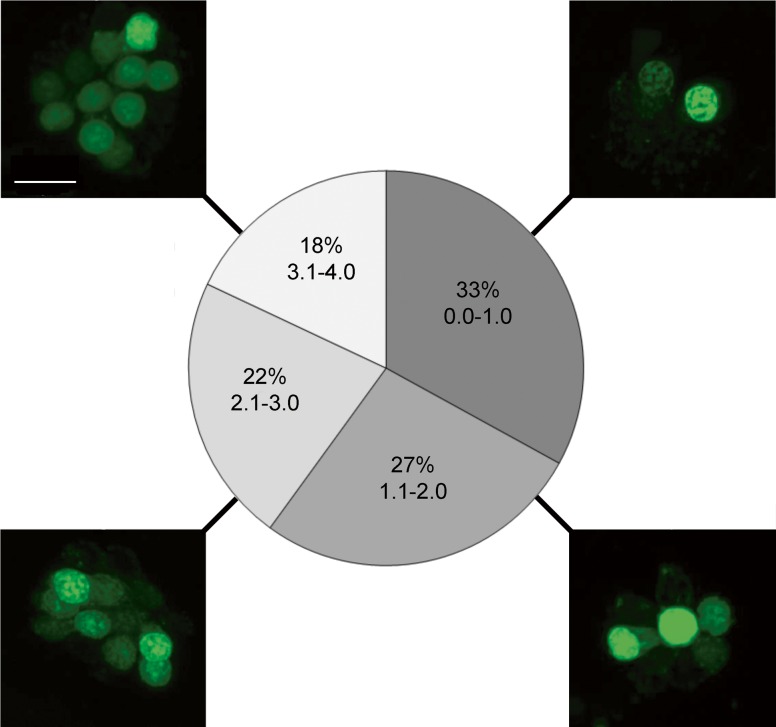
FIG. 1.
Ototoxicity screen results of the ENZO Natural Products Library. a Confocal images of a representative neuromast depicting each level of damage on a 1–4 scale, where 1 represents few to no hair cells, and 4 describes a fish with healthy neuromasts. Scale bar = 10 μm and applies to all images. b Percentage breakdown of the ototoxic potential of the 502 natural compounds. N ∼ 2300. Of the 165 compounds in the 0–1 category (darkest gray), 61 were not toxic to the fish and were re-screened in duplicate. A list of all 61 compounds is shown in Supplemental Table 1.

