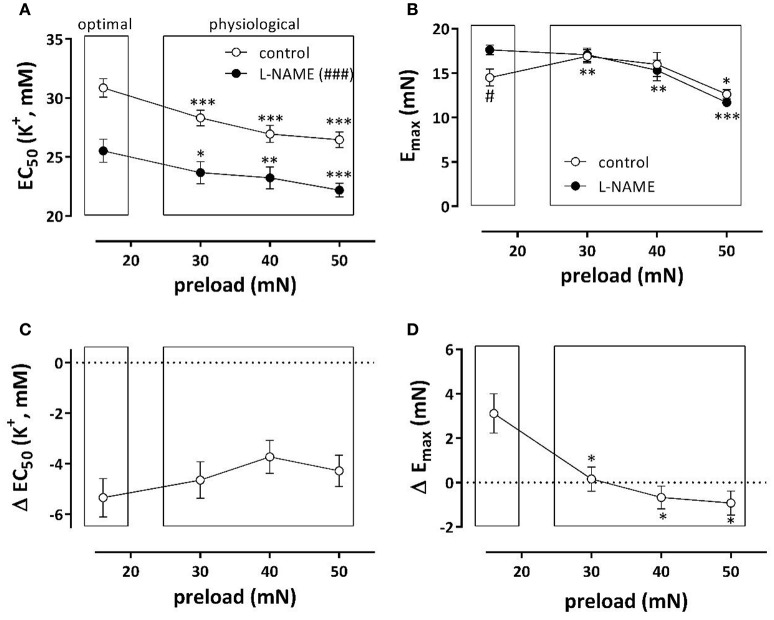
Figure 2.
Depolarization of aortic segments at different preloads. EC50 (A) and Emax (B) values of K+ concentration-response curves for depolarization of aortic segments at different preloads in the absence (eNOS active, white) and presence of 300 μM L-NAME (eNOS inactive, black). The shifts of EC50 and Emax caused by inhibition of eNOS with 300 μM L-NAME are shown in (C,D). *p < 0.05, **p < 0.01, ***p < 0.001: 30, 40, or 50 vs. 16 mN; #p < 0.05, ###p < 0.001 control vs. L-NAME, n = 7.

